Colville vs Taiwanese Median Female Earnings
COMPARE
Colville
Taiwanese
Median Female Earnings
Median Female Earnings Comparison
Colville
Taiwanese
$37,514
MEDIAN FEMALE EARNINGS
1.1/ 100
METRIC RATING
255th/ 347
METRIC RANK
$40,576
MEDIAN FEMALE EARNINGS
86.1/ 100
METRIC RATING
138th/ 347
METRIC RANK
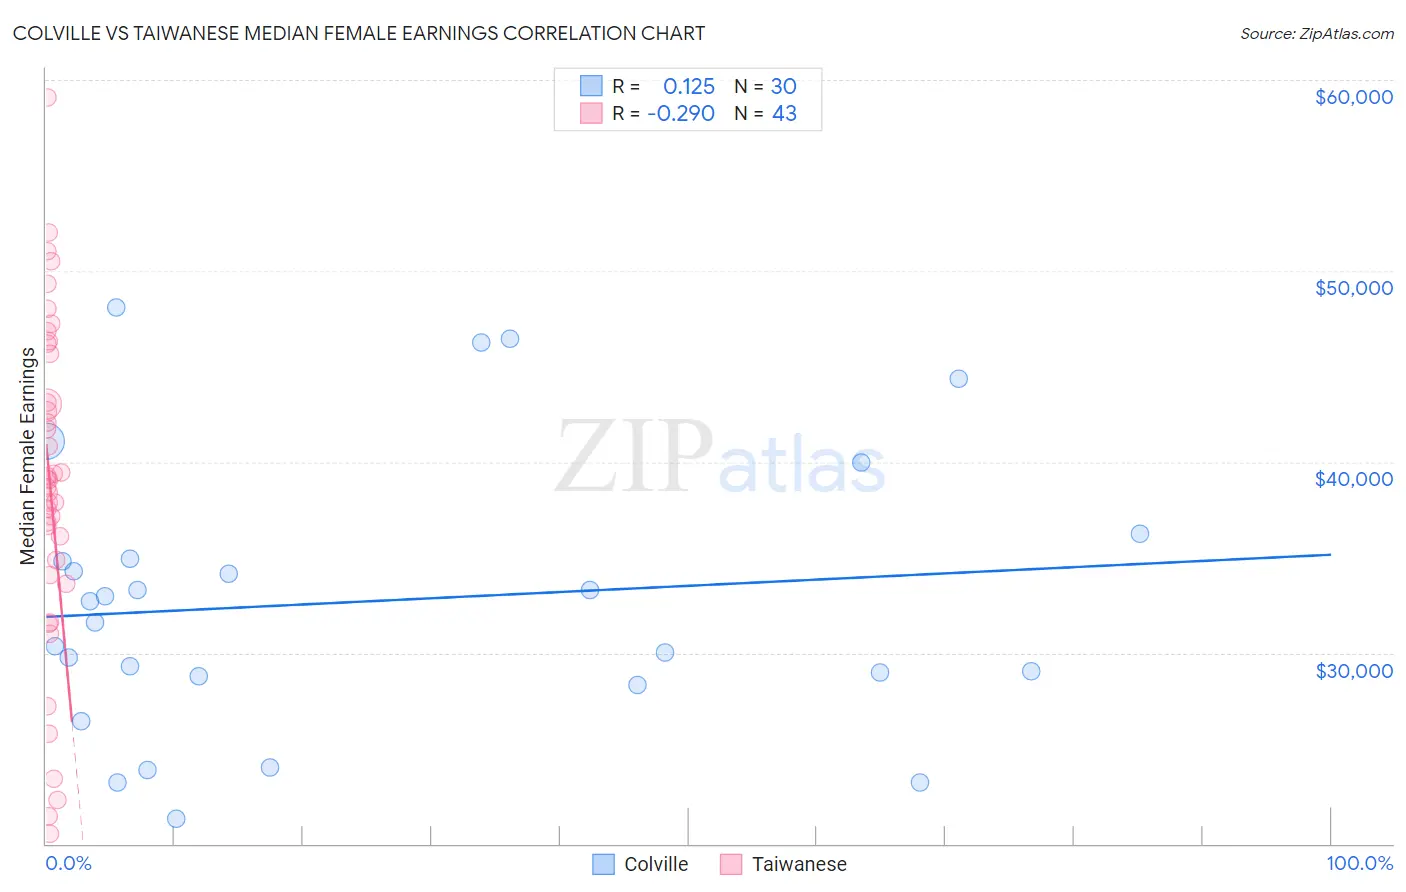
Colville vs Taiwanese Median Female Earnings Correlation Chart
The statistical analysis conducted on geographies consisting of 34,680,169 people shows a poor positive correlation between the proportion of Colville and median female earnings in the United States with a correlation coefficient (R) of 0.125 and weighted average of $37,514. Similarly, the statistical analysis conducted on geographies consisting of 31,721,885 people shows a weak negative correlation between the proportion of Taiwanese and median female earnings in the United States with a correlation coefficient (R) of -0.290 and weighted average of $40,576, a difference of 8.2%.
Median Female Earnings Correlation Summary
| Measurement | Colville | Taiwanese |
| Minimum | $21,333 | $20,555 |
| Maximum | $48,065 | $59,093 |
| Range | $26,732 | $38,538 |
| Mean | $32,694 | $38,751 |
| Median | $32,120 | $39,019 |
| Interquartile 25% (IQ1) | $28,750 | $34,095 |
| Interquartile 75% (IQ3) | $34,898 | $45,655 |
| Interquartile Range (IQR) | $6,148 | $11,560 |
| Standard Deviation (Sample) | $7,179 | $8,643 |
| Standard Deviation (Population) | $7,058 | $8,542 |
Similar Demographics by Median Female Earnings
Demographics Similar to Colville by Median Female Earnings
In terms of median female earnings, the demographic groups most similar to Colville are White/Caucasian ($37,531, a difference of 0.040%), Samoan ($37,498, a difference of 0.040%), Hawaiian ($37,497, a difference of 0.040%), Belizean ($37,429, a difference of 0.23%), and Scotch-Irish ($37,383, a difference of 0.35%).
| Demographics | Rating | Rank | Median Female Earnings |
| Alaskan Athabascans | 2.3 /100 | #248 | Tragic $37,905 |
| Swiss | 2.3 /100 | #249 | Tragic $37,904 |
| Immigrants | Iraq | 2.2 /100 | #250 | Tragic $37,864 |
| Welsh | 2.1 /100 | #251 | Tragic $37,856 |
| Immigrants | Dominica | 2.0 /100 | #252 | Tragic $37,825 |
| Danes | 1.6 /100 | #253 | Tragic $37,730 |
| Whites/Caucasians | 1.1 /100 | #254 | Tragic $37,531 |
| Colville | 1.1 /100 | #255 | Tragic $37,514 |
| Samoans | 1.0 /100 | #256 | Tragic $37,498 |
| Hawaiians | 1.0 /100 | #257 | Tragic $37,497 |
| Belizeans | 0.9 /100 | #258 | Tragic $37,429 |
| Scotch-Irish | 0.8 /100 | #259 | Tragic $37,383 |
| Dutch | 0.7 /100 | #260 | Tragic $37,339 |
| Malaysians | 0.7 /100 | #261 | Tragic $37,298 |
| Venezuelans | 0.7 /100 | #262 | Tragic $37,282 |
Demographics Similar to Taiwanese by Median Female Earnings
In terms of median female earnings, the demographic groups most similar to Taiwanese are Immigrants from South Eastern Asia ($40,558, a difference of 0.040%), Pakistani ($40,596, a difference of 0.050%), Serbian ($40,539, a difference of 0.090%), Immigrants from Eastern Africa ($40,644, a difference of 0.17%), and Immigrants from Syria ($40,499, a difference of 0.19%).
| Demographics | Rating | Rank | Median Female Earnings |
| Chileans | 90.0 /100 | #131 | Exceptional $40,757 |
| Immigrants | Uganda | 89.7 /100 | #132 | Excellent $40,739 |
| Syrians | 89.5 /100 | #133 | Excellent $40,727 |
| Arabs | 89.3 /100 | #134 | Excellent $40,718 |
| Immigrants | Nepal | 89.0 /100 | #135 | Excellent $40,704 |
| Immigrants | Eastern Africa | 87.7 /100 | #136 | Excellent $40,644 |
| Pakistanis | 86.6 /100 | #137 | Excellent $40,596 |
| Taiwanese | 86.1 /100 | #138 | Excellent $40,576 |
| Immigrants | South Eastern Asia | 85.7 /100 | #139 | Excellent $40,558 |
| Serbians | 85.2 /100 | #140 | Excellent $40,539 |
| Immigrants | Syria | 84.1 /100 | #141 | Excellent $40,499 |
| Sri Lankans | 84.0 /100 | #142 | Excellent $40,496 |
| Northern Europeans | 83.9 /100 | #143 | Excellent $40,491 |
| Immigrants | North Macedonia | 83.8 /100 | #144 | Excellent $40,488 |
| Brazilians | 83.6 /100 | #145 | Excellent $40,483 |