Seminole vs Pennsylvania German Disability Age Over 75
COMPARE
Seminole
Pennsylvania German
Disability Age Over 75
Disability Age Over 75 Comparison
Seminole
Pennsylvania Germans
51.5%
DISABILITY AGE OVER 75
0.0/ 100
METRIC RATING
318th/ 347
METRIC RANK
47.2%
DISABILITY AGE OVER 75
66.0/ 100
METRIC RATING
162nd/ 347
METRIC RANK
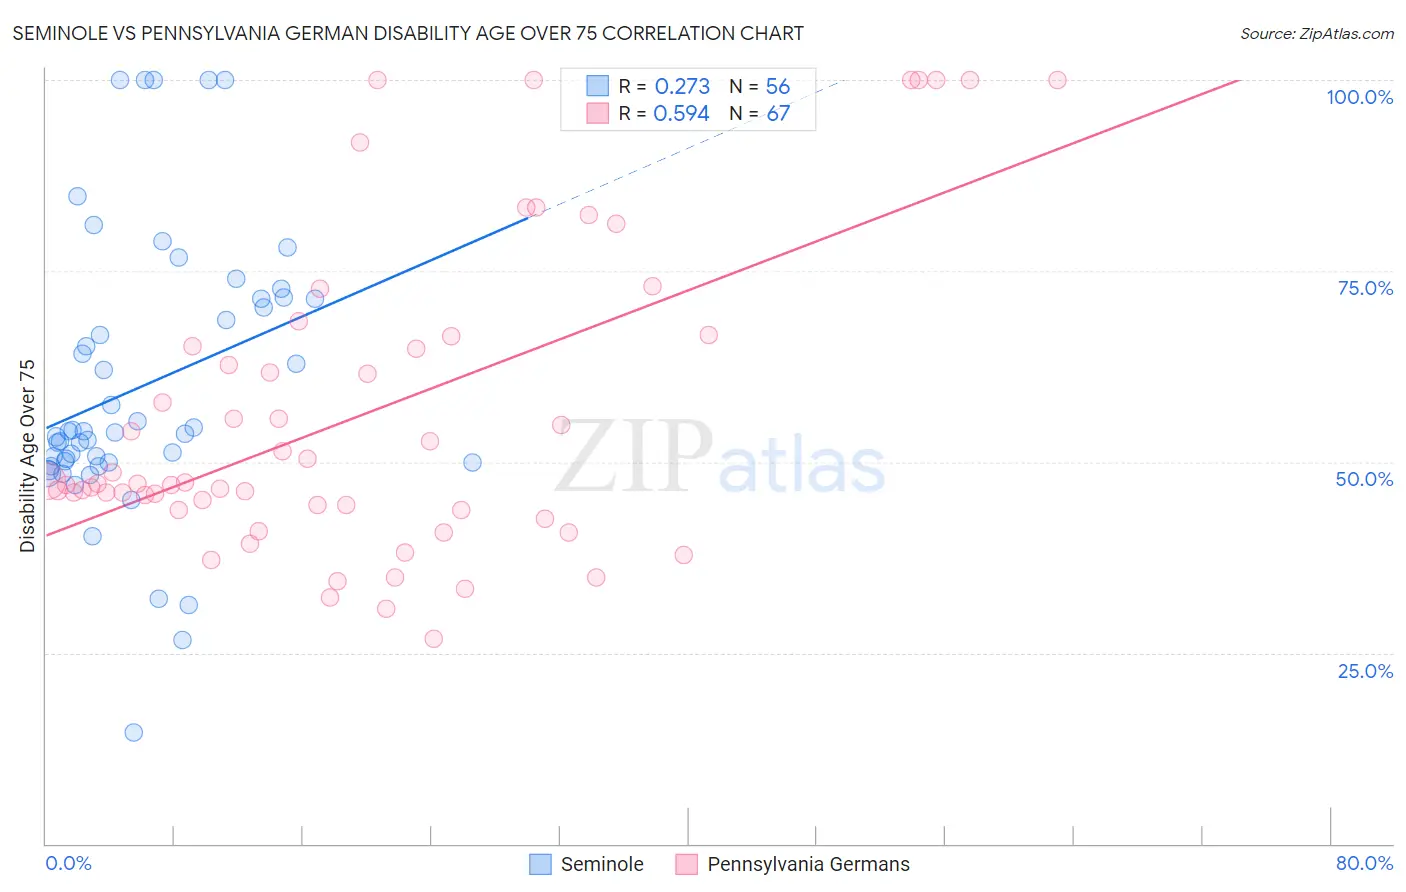
Seminole vs Pennsylvania German Disability Age Over 75 Correlation Chart
The statistical analysis conducted on geographies consisting of 118,267,325 people shows a weak positive correlation between the proportion of Seminole and percentage of population with a disability over the age of 75 in the United States with a correlation coefficient (R) of 0.273 and weighted average of 51.5%. Similarly, the statistical analysis conducted on geographies consisting of 233,972,902 people shows a substantial positive correlation between the proportion of Pennsylvania Germans and percentage of population with a disability over the age of 75 in the United States with a correlation coefficient (R) of 0.594 and weighted average of 47.2%, a difference of 9.1%.
Disability Age Over 75 Correlation Summary
| Measurement | Seminole | Pennsylvania German |
| Minimum | 14.6% | 26.8% |
| Maximum | 100.0% | 100.0% |
| Range | 85.4% | 73.2% |
| Mean | 59.9% | 56.4% |
| Median | 53.9% | 47.2% |
| Interquartile 25% (IQ1) | 50.0% | 43.8% |
| Interquartile 75% (IQ3) | 71.4% | 66.5% |
| Interquartile Range (IQR) | 21.4% | 22.8% |
| Standard Deviation (Sample) | 18.4% | 20.3% |
| Standard Deviation (Population) | 18.2% | 20.2% |
Similar Demographics by Disability Age Over 75
Demographics Similar to Seminole by Disability Age Over 75
In terms of disability age over 75, the demographic groups most similar to Seminole are Creek (51.5%, a difference of 0.0%), Paiute (51.5%, a difference of 0.14%), Dutch West Indian (51.5%, a difference of 0.15%), Yakama (51.3%, a difference of 0.33%), and Comanche (51.7%, a difference of 0.49%).
| Demographics | Rating | Rank | Disability Age Over 75 |
| Cajuns | 0.0 /100 | #311 | Tragic 50.7% |
| Cheyenne | 0.0 /100 | #312 | Tragic 50.9% |
| Immigrants | Azores | 0.0 /100 | #313 | Tragic 50.9% |
| Immigrants | Mexico | 0.0 /100 | #314 | Tragic 51.1% |
| Mexicans | 0.0 /100 | #315 | Tragic 51.1% |
| Chickasaw | 0.0 /100 | #316 | Tragic 51.2% |
| Yakama | 0.0 /100 | #317 | Tragic 51.3% |
| Seminole | 0.0 /100 | #318 | Tragic 51.5% |
| Creek | 0.0 /100 | #319 | Tragic 51.5% |
| Paiute | 0.0 /100 | #320 | Tragic 51.5% |
| Dutch West Indians | 0.0 /100 | #321 | Tragic 51.5% |
| Comanche | 0.0 /100 | #322 | Tragic 51.7% |
| Immigrants | Yemen | 0.0 /100 | #323 | Tragic 52.0% |
| Menominee | 0.0 /100 | #324 | Tragic 52.3% |
| Immigrants | Cabo Verde | 0.0 /100 | #325 | Tragic 52.4% |
Demographics Similar to Pennsylvania Germans by Disability Age Over 75
In terms of disability age over 75, the demographic groups most similar to Pennsylvania Germans are Immigrants from Eastern Africa (47.2%, a difference of 0.010%), French (47.2%, a difference of 0.030%), Immigrants from Zimbabwe (47.2%, a difference of 0.040%), Immigrants from Sierra Leone (47.2%, a difference of 0.040%), and South American Indian (47.1%, a difference of 0.050%).
| Demographics | Rating | Rank | Disability Age Over 75 |
| Immigrants | Iran | 74.7 /100 | #155 | Good 47.1% |
| Arabs | 73.3 /100 | #156 | Good 47.1% |
| Bhutanese | 72.6 /100 | #157 | Good 47.1% |
| Immigrants | Guyana | 71.9 /100 | #158 | Good 47.1% |
| Immigrants | Morocco | 71.4 /100 | #159 | Good 47.1% |
| Immigrants | Middle Africa | 68.3 /100 | #160 | Good 47.1% |
| South American Indians | 68.1 /100 | #161 | Good 47.1% |
| Pennsylvania Germans | 66.0 /100 | #162 | Good 47.2% |
| Immigrants | Eastern Africa | 65.5 /100 | #163 | Good 47.2% |
| French | 64.6 /100 | #164 | Good 47.2% |
| Immigrants | Zimbabwe | 64.4 /100 | #165 | Good 47.2% |
| Immigrants | Sierra Leone | 64.4 /100 | #166 | Good 47.2% |
| Moroccans | 62.9 /100 | #167 | Good 47.2% |
| Kenyans | 58.8 /100 | #168 | Average 47.2% |
| Celtics | 58.7 /100 | #169 | Average 47.2% |