Immigrants from Greece vs Immigrants from El Salvador Median Household Income
COMPARE
Immigrants from Greece
Immigrants from El Salvador
Median Household Income
Median Household Income Comparison
Immigrants from Greece
Immigrants from El Salvador
$96,675
MEDIAN HOUSEHOLD INCOME
99.9/ 100
METRIC RATING
44th/ 347
METRIC RANK
$81,213
MEDIAN HOUSEHOLD INCOME
7.6/ 100
METRIC RATING
223rd/ 347
METRIC RANK
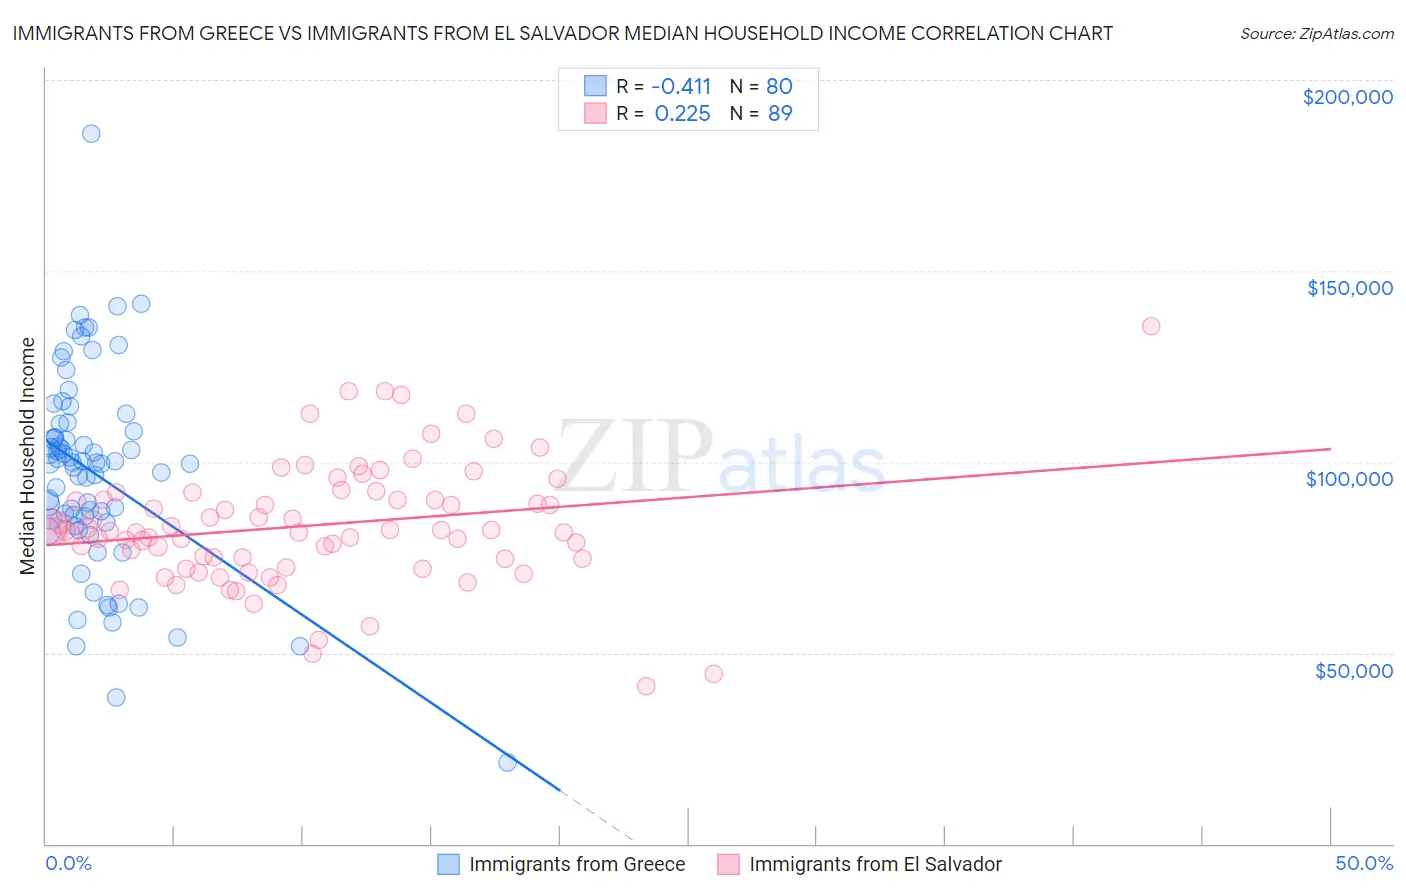
Immigrants from Greece vs Immigrants from El Salvador Median Household Income Correlation Chart
The statistical analysis conducted on geographies consisting of 216,849,676 people shows a moderate negative correlation between the proportion of Immigrants from Greece and median household income in the United States with a correlation coefficient (R) of -0.411 and weighted average of $96,675. Similarly, the statistical analysis conducted on geographies consisting of 357,662,505 people shows a weak positive correlation between the proportion of Immigrants from El Salvador and median household income in the United States with a correlation coefficient (R) of 0.225 and weighted average of $81,213, a difference of 19.0%.
Median Household Income Correlation Summary
| Measurement | Immigrants from Greece | Immigrants from El Salvador |
| Minimum | $21,344 | $41,123 |
| Maximum | $185,804 | $135,638 |
| Range | $164,460 | $94,515 |
| Mean | $97,069 | $83,315 |
| Median | $99,595 | $81,957 |
| Interquartile 25% (IQ1) | $84,501 | $74,629 |
| Interquartile 75% (IQ3) | $109,048 | $91,081 |
| Interquartile Range (IQR) | $24,547 | $16,452 |
| Standard Deviation (Sample) | $26,271 | $15,893 |
| Standard Deviation (Population) | $26,106 | $15,803 |
Similar Demographics by Median Household Income
Demographics Similar to Immigrants from Greece by Median Household Income
In terms of median household income, the demographic groups most similar to Immigrants from Greece are Immigrants from France ($96,743, a difference of 0.070%), Israeli ($96,552, a difference of 0.13%), Immigrants from Lithuania ($96,836, a difference of 0.17%), Australian ($96,490, a difference of 0.19%), and Immigrants from Turkey ($96,964, a difference of 0.30%).
| Demographics | Rating | Rank | Median Household Income |
| Latvians | 100.0 /100 | #37 | Exceptional $97,311 |
| Immigrants | Indonesia | 100.0 /100 | #38 | Exceptional $97,297 |
| Afghans | 100.0 /100 | #39 | Exceptional $97,026 |
| Maltese | 100.0 /100 | #40 | Exceptional $97,015 |
| Immigrants | Turkey | 100.0 /100 | #41 | Exceptional $96,964 |
| Immigrants | Lithuania | 99.9 /100 | #42 | Exceptional $96,836 |
| Immigrants | France | 99.9 /100 | #43 | Exceptional $96,743 |
| Immigrants | Greece | 99.9 /100 | #44 | Exceptional $96,675 |
| Israelis | 99.9 /100 | #45 | Exceptional $96,552 |
| Australians | 99.9 /100 | #46 | Exceptional $96,490 |
| Immigrants | Russia | 99.9 /100 | #47 | Exceptional $96,378 |
| Cambodians | 99.9 /100 | #48 | Exceptional $96,324 |
| Immigrants | Malaysia | 99.9 /100 | #49 | Exceptional $96,292 |
| Bulgarians | 99.9 /100 | #50 | Exceptional $96,290 |
| Estonians | 99.9 /100 | #51 | Exceptional $95,930 |
Demographics Similar to Immigrants from El Salvador by Median Household Income
In terms of median household income, the demographic groups most similar to Immigrants from El Salvador are Immigrants from Nigeria ($81,236, a difference of 0.030%), Malaysian ($81,064, a difference of 0.18%), Scotch-Irish ($80,972, a difference of 0.30%), Immigrants from Ghana ($81,489, a difference of 0.34%), and Immigrants from Venezuela ($81,506, a difference of 0.36%).
| Demographics | Rating | Rank | Median Household Income |
| Yugoslavians | 13.3 /100 | #216 | Poor $82,186 |
| Ecuadorians | 12.5 /100 | #217 | Poor $82,070 |
| Whites/Caucasians | 12.2 /100 | #218 | Poor $82,029 |
| Nigerians | 10.3 /100 | #219 | Poor $81,725 |
| Immigrants | Venezuela | 9.0 /100 | #220 | Tragic $81,506 |
| Immigrants | Ghana | 9.0 /100 | #221 | Tragic $81,489 |
| Immigrants | Nigeria | 7.7 /100 | #222 | Tragic $81,236 |
| Immigrants | El Salvador | 7.6 /100 | #223 | Tragic $81,213 |
| Malaysians | 7.0 /100 | #224 | Tragic $81,064 |
| Scotch-Irish | 6.6 /100 | #225 | Tragic $80,972 |
| Immigrants | Panama | 6.2 /100 | #226 | Tragic $80,873 |
| Guyanese | 5.7 /100 | #227 | Tragic $80,734 |
| Immigrants | Bangladesh | 5.7 /100 | #228 | Tragic $80,722 |
| Delaware | 5.0 /100 | #229 | Tragic $80,527 |
| Bermudans | 4.7 /100 | #230 | Tragic $80,406 |