Immigrants from Ethiopia vs Immigrants from El Salvador Median Household Income
COMPARE
Immigrants from Ethiopia
Immigrants from El Salvador
Median Household Income
Median Household Income Comparison
Immigrants from Ethiopia
Immigrants from El Salvador
$88,687
MEDIAN HOUSEHOLD INCOME
90.9/ 100
METRIC RATING
133rd/ 347
METRIC RANK
$81,213
MEDIAN HOUSEHOLD INCOME
7.6/ 100
METRIC RATING
223rd/ 347
METRIC RANK
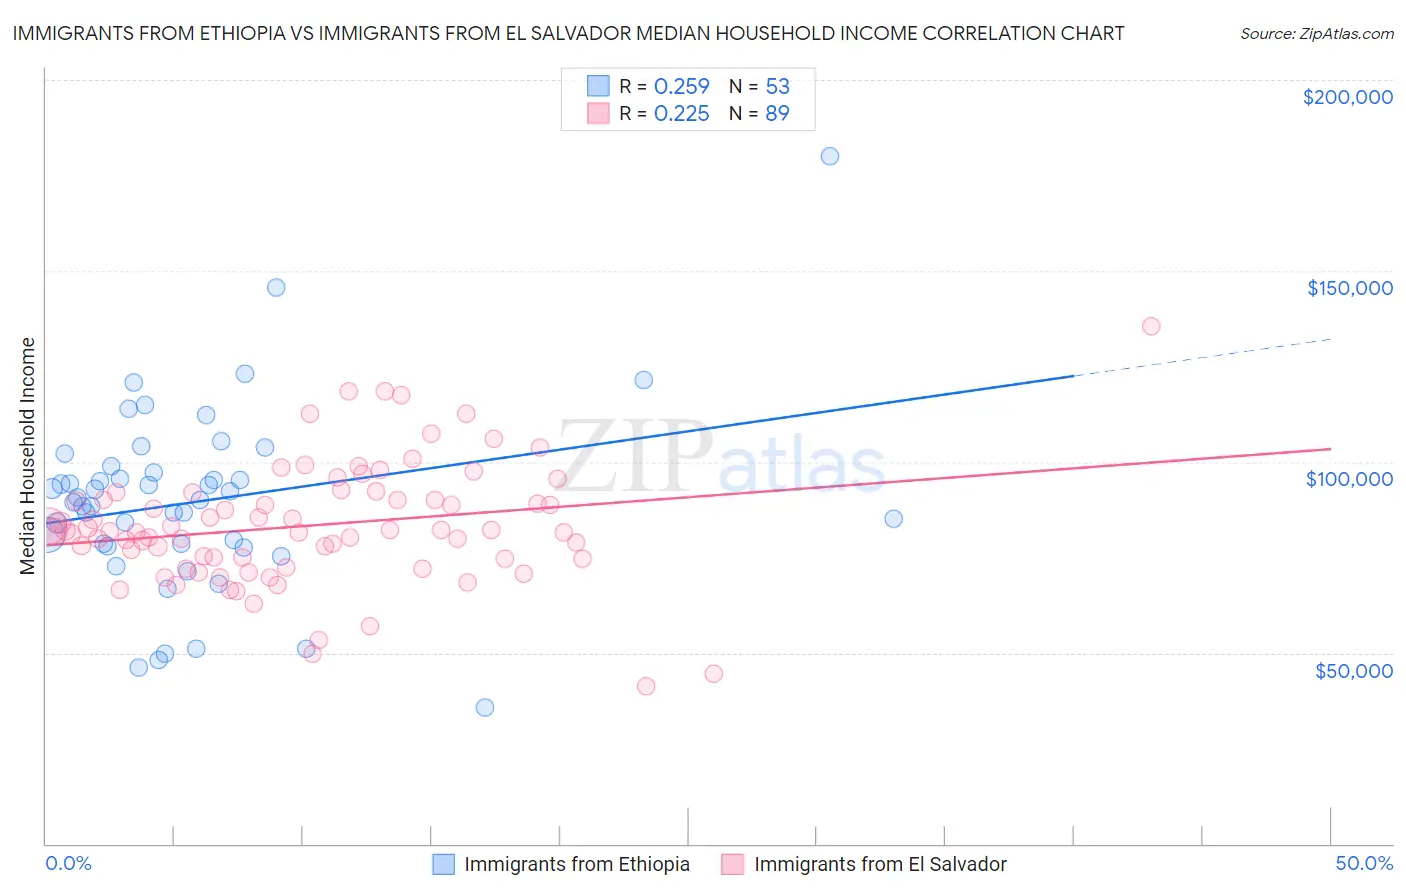
Immigrants from Ethiopia vs Immigrants from El Salvador Median Household Income Correlation Chart
The statistical analysis conducted on geographies consisting of 211,436,017 people shows a weak positive correlation between the proportion of Immigrants from Ethiopia and median household income in the United States with a correlation coefficient (R) of 0.259 and weighted average of $88,687. Similarly, the statistical analysis conducted on geographies consisting of 357,662,505 people shows a weak positive correlation between the proportion of Immigrants from El Salvador and median household income in the United States with a correlation coefficient (R) of 0.225 and weighted average of $81,213, a difference of 9.2%.
Median Household Income Correlation Summary
| Measurement | Immigrants from Ethiopia | Immigrants from El Salvador |
| Minimum | $35,809 | $41,123 |
| Maximum | $180,167 | $135,638 |
| Range | $144,358 | $94,515 |
| Mean | $89,607 | $83,315 |
| Median | $90,025 | $81,957 |
| Interquartile 25% (IQ1) | $78,327 | $74,629 |
| Interquartile 75% (IQ3) | $98,118 | $91,081 |
| Interquartile Range (IQR) | $19,791 | $16,452 |
| Standard Deviation (Sample) | $24,432 | $15,893 |
| Standard Deviation (Population) | $24,200 | $15,803 |
Similar Demographics by Median Household Income
Demographics Similar to Immigrants from Ethiopia by Median Household Income
In terms of median household income, the demographic groups most similar to Immigrants from Ethiopia are European ($88,751, a difference of 0.070%), Immigrants from Syria ($88,792, a difference of 0.12%), Swedish ($88,524, a difference of 0.18%), Immigrants from Sierra Leone ($88,498, a difference of 0.21%), and Polish ($88,472, a difference of 0.24%).
| Demographics | Rating | Rank | Median Household Income |
| Immigrants | Oceania | 92.9 /100 | #126 | Exceptional $89,100 |
| Immigrants | Peru | 92.5 /100 | #127 | Exceptional $89,010 |
| Portuguese | 92.3 /100 | #128 | Exceptional $88,976 |
| Brazilians | 92.1 /100 | #129 | Exceptional $88,934 |
| British | 92.0 /100 | #130 | Exceptional $88,914 |
| Immigrants | Syria | 91.4 /100 | #131 | Exceptional $88,792 |
| Europeans | 91.2 /100 | #132 | Exceptional $88,751 |
| Immigrants | Ethiopia | 90.9 /100 | #133 | Exceptional $88,687 |
| Swedes | 90.0 /100 | #134 | Exceptional $88,524 |
| Immigrants | Sierra Leone | 89.9 /100 | #135 | Excellent $88,498 |
| Poles | 89.7 /100 | #136 | Excellent $88,472 |
| Sierra Leoneans | 89.6 /100 | #137 | Excellent $88,463 |
| Arabs | 89.2 /100 | #138 | Excellent $88,398 |
| Immigrants | Chile | 89.2 /100 | #139 | Excellent $88,388 |
| Lebanese | 87.2 /100 | #140 | Excellent $88,091 |
Demographics Similar to Immigrants from El Salvador by Median Household Income
In terms of median household income, the demographic groups most similar to Immigrants from El Salvador are Immigrants from Nigeria ($81,236, a difference of 0.030%), Malaysian ($81,064, a difference of 0.18%), Scotch-Irish ($80,972, a difference of 0.30%), Immigrants from Ghana ($81,489, a difference of 0.34%), and Immigrants from Venezuela ($81,506, a difference of 0.36%).
| Demographics | Rating | Rank | Median Household Income |
| Yugoslavians | 13.3 /100 | #216 | Poor $82,186 |
| Ecuadorians | 12.5 /100 | #217 | Poor $82,070 |
| Whites/Caucasians | 12.2 /100 | #218 | Poor $82,029 |
| Nigerians | 10.3 /100 | #219 | Poor $81,725 |
| Immigrants | Venezuela | 9.0 /100 | #220 | Tragic $81,506 |
| Immigrants | Ghana | 9.0 /100 | #221 | Tragic $81,489 |
| Immigrants | Nigeria | 7.7 /100 | #222 | Tragic $81,236 |
| Immigrants | El Salvador | 7.6 /100 | #223 | Tragic $81,213 |
| Malaysians | 7.0 /100 | #224 | Tragic $81,064 |
| Scotch-Irish | 6.6 /100 | #225 | Tragic $80,972 |
| Immigrants | Panama | 6.2 /100 | #226 | Tragic $80,873 |
| Guyanese | 5.7 /100 | #227 | Tragic $80,734 |
| Immigrants | Bangladesh | 5.7 /100 | #228 | Tragic $80,722 |
| Delaware | 5.0 /100 | #229 | Tragic $80,527 |
| Bermudans | 4.7 /100 | #230 | Tragic $80,406 |