Bermudan vs Filipino Householder Income Ages 45 - 64 years
COMPARE
Bermudan
Filipino
Householder Income Ages 45 - 64 years
Householder Income Ages 45 - 64 years Comparison
Bermudans
Filipinos
$94,197
HOUSEHOLDER INCOME AGES 45 - 64 YEARS
4.4/ 100
METRIC RATING
225th/ 347
METRIC RANK
$134,910
HOUSEHOLDER INCOME AGES 45 - 64 YEARS
100.0/ 100
METRIC RATING
2nd/ 347
METRIC RANK
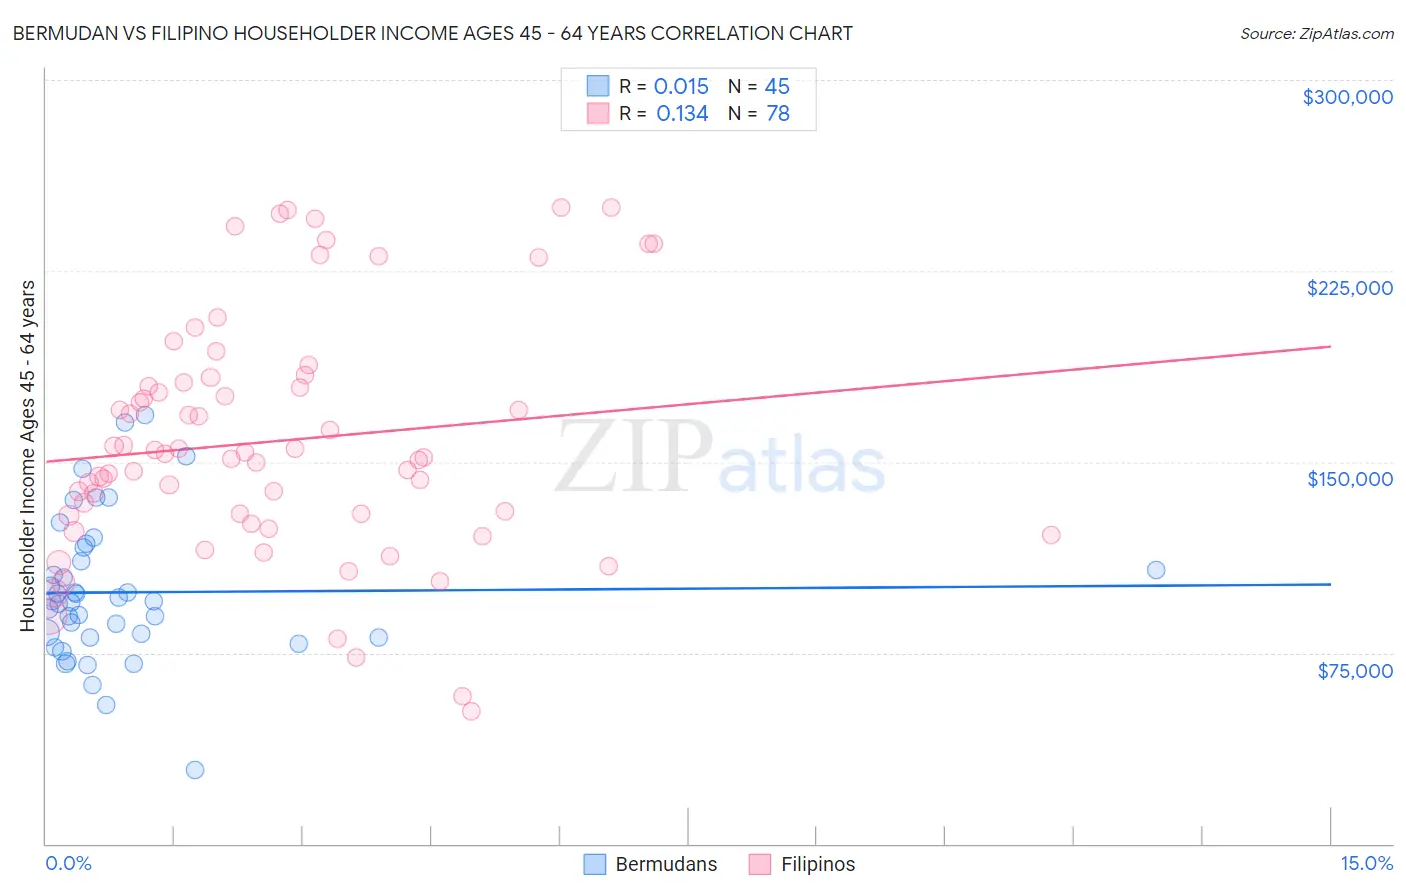
Bermudan vs Filipino Householder Income Ages 45 - 64 years Correlation Chart
The statistical analysis conducted on geographies consisting of 55,700,140 people shows no correlation between the proportion of Bermudans and household income with householder between the ages 45 and 64 in the United States with a correlation coefficient (R) of 0.015 and weighted average of $94,197. Similarly, the statistical analysis conducted on geographies consisting of 254,006,751 people shows a poor positive correlation between the proportion of Filipinos and household income with householder between the ages 45 and 64 in the United States with a correlation coefficient (R) of 0.134 and weighted average of $134,910, a difference of 43.2%.
Householder Income Ages 45 - 64 years Correlation Summary
| Measurement | Bermudan | Filipino |
| Minimum | $28,750 | $51,856 |
| Maximum | $168,207 | $250,001 |
| Range | $139,457 | $198,145 |
| Mean | $98,773 | $158,185 |
| Median | $95,242 | $152,545 |
| Interquartile 25% (IQ1) | $80,989 | $128,904 |
| Interquartile 75% (IQ3) | $113,573 | $181,123 |
| Interquartile Range (IQR) | $32,583 | $52,219 |
| Standard Deviation (Sample) | $28,344 | $46,977 |
| Standard Deviation (Population) | $28,027 | $46,675 |
Similar Demographics by Householder Income Ages 45 - 64 years
Demographics Similar to Bermudans by Householder Income Ages 45 - 64 years
In terms of householder income ages 45 - 64 years, the demographic groups most similar to Bermudans are Immigrants from the Azores ($94,138, a difference of 0.060%), Immigrants from Bosnia and Herzegovina ($94,288, a difference of 0.10%), Alaska Native ($93,991, a difference of 0.22%), Nonimmigrants ($94,448, a difference of 0.27%), and Malaysian ($94,517, a difference of 0.34%).
| Demographics | Rating | Rank | Householder Income Ages 45 - 64 years |
| Delaware | 6.2 /100 | #218 | Tragic $94,914 |
| Immigrants | Armenia | 6.1 /100 | #219 | Tragic $94,863 |
| Salvadorans | 6.0 /100 | #220 | Tragic $94,842 |
| Immigrants | Nigeria | 5.9 /100 | #221 | Tragic $94,804 |
| Malaysians | 5.2 /100 | #222 | Tragic $94,517 |
| Immigrants | Nonimmigrants | 5.0 /100 | #223 | Tragic $94,448 |
| Immigrants | Bosnia and Herzegovina | 4.6 /100 | #224 | Tragic $94,288 |
| Bermudans | 4.4 /100 | #225 | Tragic $94,197 |
| Immigrants | Azores | 4.3 /100 | #226 | Tragic $94,138 |
| Alaska Natives | 4.0 /100 | #227 | Tragic $93,991 |
| Immigrants | Panama | 3.7 /100 | #228 | Tragic $93,815 |
| Vietnamese | 3.6 /100 | #229 | Tragic $93,788 |
| Immigrants | Sudan | 3.6 /100 | #230 | Tragic $93,781 |
| Ecuadorians | 3.6 /100 | #231 | Tragic $93,739 |
| Sudanese | 3.5 /100 | #232 | Tragic $93,718 |
Demographics Similar to Filipinos by Householder Income Ages 45 - 64 years
In terms of householder income ages 45 - 64 years, the demographic groups most similar to Filipinos are Immigrants from Taiwan ($135,508, a difference of 0.44%), Immigrants from India ($132,488, a difference of 1.8%), Thai ($129,560, a difference of 4.1%), Immigrants from Singapore ($129,514, a difference of 4.2%), and Iranian ($129,350, a difference of 4.3%).
| Demographics | Rating | Rank | Householder Income Ages 45 - 64 years |
| Immigrants | Taiwan | 100.0 /100 | #1 | Exceptional $135,508 |
| Filipinos | 100.0 /100 | #2 | Exceptional $134,910 |
| Immigrants | India | 100.0 /100 | #3 | Exceptional $132,488 |
| Thais | 100.0 /100 | #4 | Exceptional $129,560 |
| Immigrants | Singapore | 100.0 /100 | #5 | Exceptional $129,514 |
| Iranians | 100.0 /100 | #6 | Exceptional $129,350 |
| Immigrants | Hong Kong | 100.0 /100 | #7 | Exceptional $127,500 |
| Immigrants | Iran | 100.0 /100 | #8 | Exceptional $126,940 |
| Okinawans | 100.0 /100 | #9 | Exceptional $124,796 |
| Immigrants | South Central Asia | 100.0 /100 | #10 | Exceptional $124,188 |
| Cypriots | 100.0 /100 | #11 | Exceptional $123,396 |
| Immigrants | Israel | 100.0 /100 | #12 | Exceptional $122,893 |
| Immigrants | Ireland | 100.0 /100 | #13 | Exceptional $122,757 |
| Indians (Asian) | 100.0 /100 | #14 | Exceptional $122,343 |
| Immigrants | Eastern Asia | 100.0 /100 | #15 | Exceptional $122,222 |