Immigrants from Bosnia and Herzegovina vs Immigrants from Eritrea Householder Income Ages 45 - 64 years
COMPARE
Immigrants from Bosnia and Herzegovina
Immigrants from Eritrea
Householder Income Ages 45 - 64 years
Householder Income Ages 45 - 64 years Comparison
Immigrants from Bosnia and Herzegovina
Immigrants from Eritrea
$94,288
HOUSEHOLDER INCOME AGES 45 - 64 YEARS
4.6/ 100
METRIC RATING
224th/ 347
METRIC RANK
$97,373
HOUSEHOLDER INCOME AGES 45 - 64 YEARS
18.6/ 100
METRIC RATING
204th/ 347
METRIC RANK
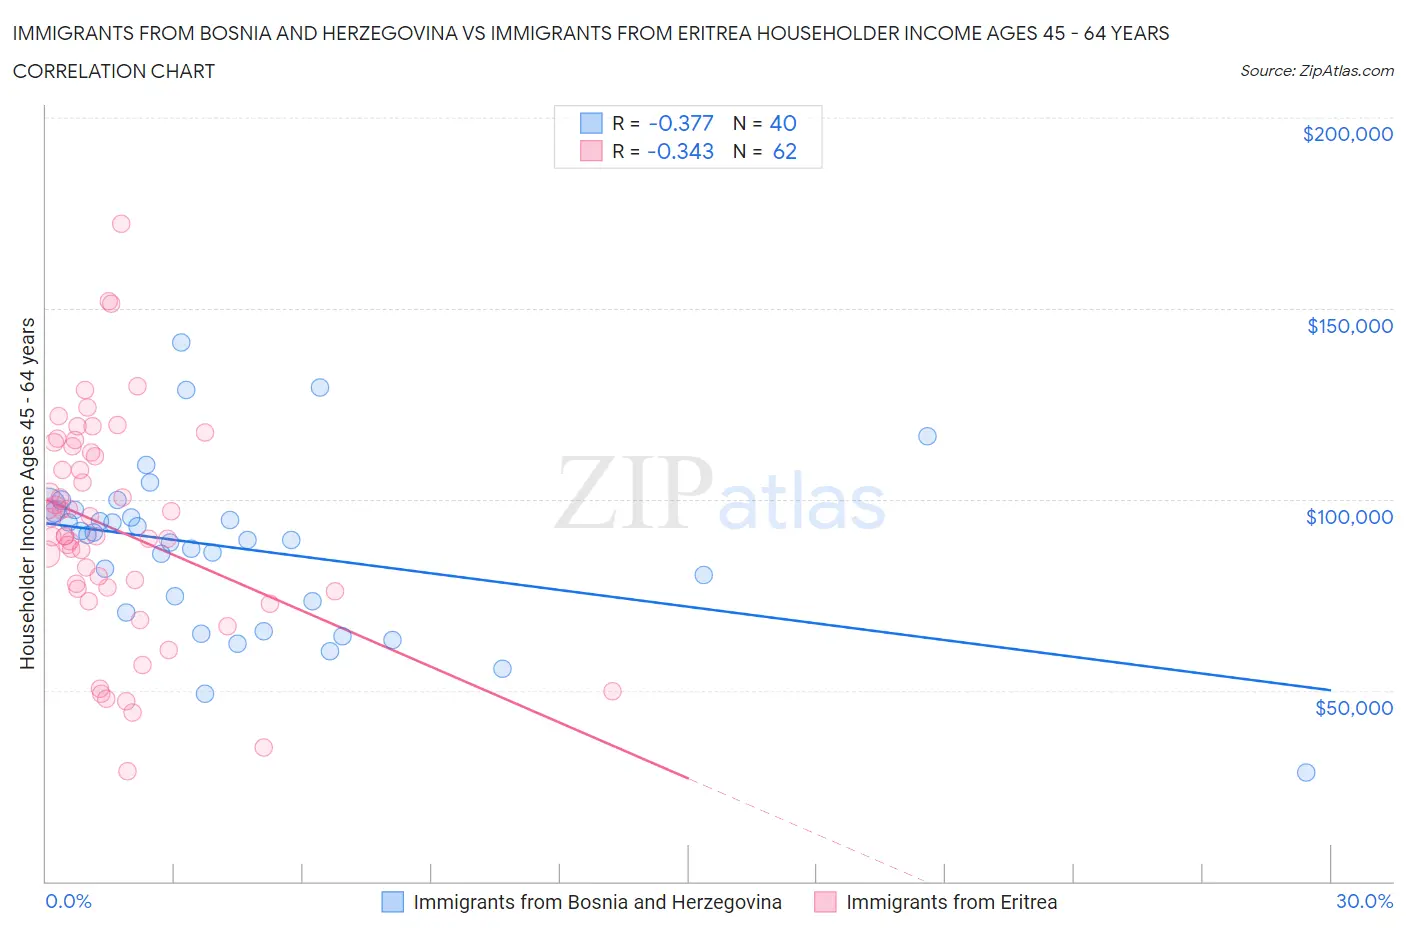
Immigrants from Bosnia and Herzegovina vs Immigrants from Eritrea Householder Income Ages 45 - 64 years Correlation Chart
The statistical analysis conducted on geographies consisting of 156,795,002 people shows a mild negative correlation between the proportion of Immigrants from Bosnia and Herzegovina and household income with householder between the ages 45 and 64 in the United States with a correlation coefficient (R) of -0.377 and weighted average of $94,288. Similarly, the statistical analysis conducted on geographies consisting of 104,839,257 people shows a mild negative correlation between the proportion of Immigrants from Eritrea and household income with householder between the ages 45 and 64 in the United States with a correlation coefficient (R) of -0.343 and weighted average of $97,373, a difference of 3.3%.
Householder Income Ages 45 - 64 years Correlation Summary
| Measurement | Immigrants from Bosnia and Herzegovina | Immigrants from Eritrea |
| Minimum | $28,542 | $28,839 |
| Maximum | $140,991 | $172,216 |
| Range | $112,449 | $143,377 |
| Mean | $87,003 | $92,178 |
| Median | $90,049 | $90,363 |
| Interquartile 25% (IQ1) | $71,932 | $76,571 |
| Interquartile 75% (IQ3) | $97,030 | $112,271 |
| Interquartile Range (IQR) | $25,098 | $35,701 |
| Standard Deviation (Sample) | $22,077 | $28,505 |
| Standard Deviation (Population) | $21,799 | $28,274 |
Demographics Similar to Immigrants from Bosnia and Herzegovina and Immigrants from Eritrea by Householder Income Ages 45 - 64 years
In terms of householder income ages 45 - 64 years, the demographic groups most similar to Immigrants from Bosnia and Herzegovina are Nonimmigrants ($94,448, a difference of 0.17%), Malaysian ($94,517, a difference of 0.24%), Immigrants from Nigeria ($94,804, a difference of 0.55%), Salvadoran ($94,842, a difference of 0.59%), and Immigrants from Armenia ($94,863, a difference of 0.61%). Similarly, the demographic groups most similar to Immigrants from Eritrea are Immigrants from Colombia ($97,290, a difference of 0.090%), Immigrants from Africa ($97,284, a difference of 0.090%), Ghanaian ($97,277, a difference of 0.10%), Scotch-Irish ($97,073, a difference of 0.31%), and Japanese ($96,834, a difference of 0.56%).
| Demographics | Rating | Rank | Householder Income Ages 45 - 64 years |
| Immigrants | Eritrea | 18.6 /100 | #204 | Poor $97,373 |
| Immigrants | Colombia | 18.0 /100 | #205 | Poor $97,290 |
| Immigrants | Africa | 17.9 /100 | #206 | Poor $97,284 |
| Ghanaians | 17.9 /100 | #207 | Poor $97,277 |
| Scotch-Irish | 16.4 /100 | #208 | Poor $97,073 |
| Japanese | 14.8 /100 | #209 | Poor $96,834 |
| Tsimshian | 14.5 /100 | #210 | Poor $96,783 |
| Immigrants | Cambodia | 13.0 /100 | #211 | Poor $96,537 |
| Venezuelans | 12.6 /100 | #212 | Poor $96,460 |
| Immigrants | Uruguay | 10.7 /100 | #213 | Poor $96,086 |
| Panamanians | 10.6 /100 | #214 | Poor $96,066 |
| Nigerians | 8.2 /100 | #215 | Tragic $95,492 |
| Immigrants | Venezuela | 7.6 /100 | #216 | Tragic $95,342 |
| Immigrants | Ghana | 6.4 /100 | #217 | Tragic $94,982 |
| Delaware | 6.2 /100 | #218 | Tragic $94,914 |
| Immigrants | Armenia | 6.1 /100 | #219 | Tragic $94,863 |
| Salvadorans | 6.0 /100 | #220 | Tragic $94,842 |
| Immigrants | Nigeria | 5.9 /100 | #221 | Tragic $94,804 |
| Malaysians | 5.2 /100 | #222 | Tragic $94,517 |
| Immigrants | Nonimmigrants | 5.0 /100 | #223 | Tragic $94,448 |
| Immigrants | Bosnia and Herzegovina | 4.6 /100 | #224 | Tragic $94,288 |