Immigrants from Eastern Europe vs Immigrants from Eritrea Householder Income Ages 45 - 64 years
COMPARE
Immigrants from Eastern Europe
Immigrants from Eritrea
Householder Income Ages 45 - 64 years
Householder Income Ages 45 - 64 years Comparison
Immigrants from Eastern Europe
Immigrants from Eritrea
$109,335
HOUSEHOLDER INCOME AGES 45 - 64 YEARS
98.9/ 100
METRIC RATING
81st/ 347
METRIC RANK
$97,373
HOUSEHOLDER INCOME AGES 45 - 64 YEARS
18.6/ 100
METRIC RATING
204th/ 347
METRIC RANK
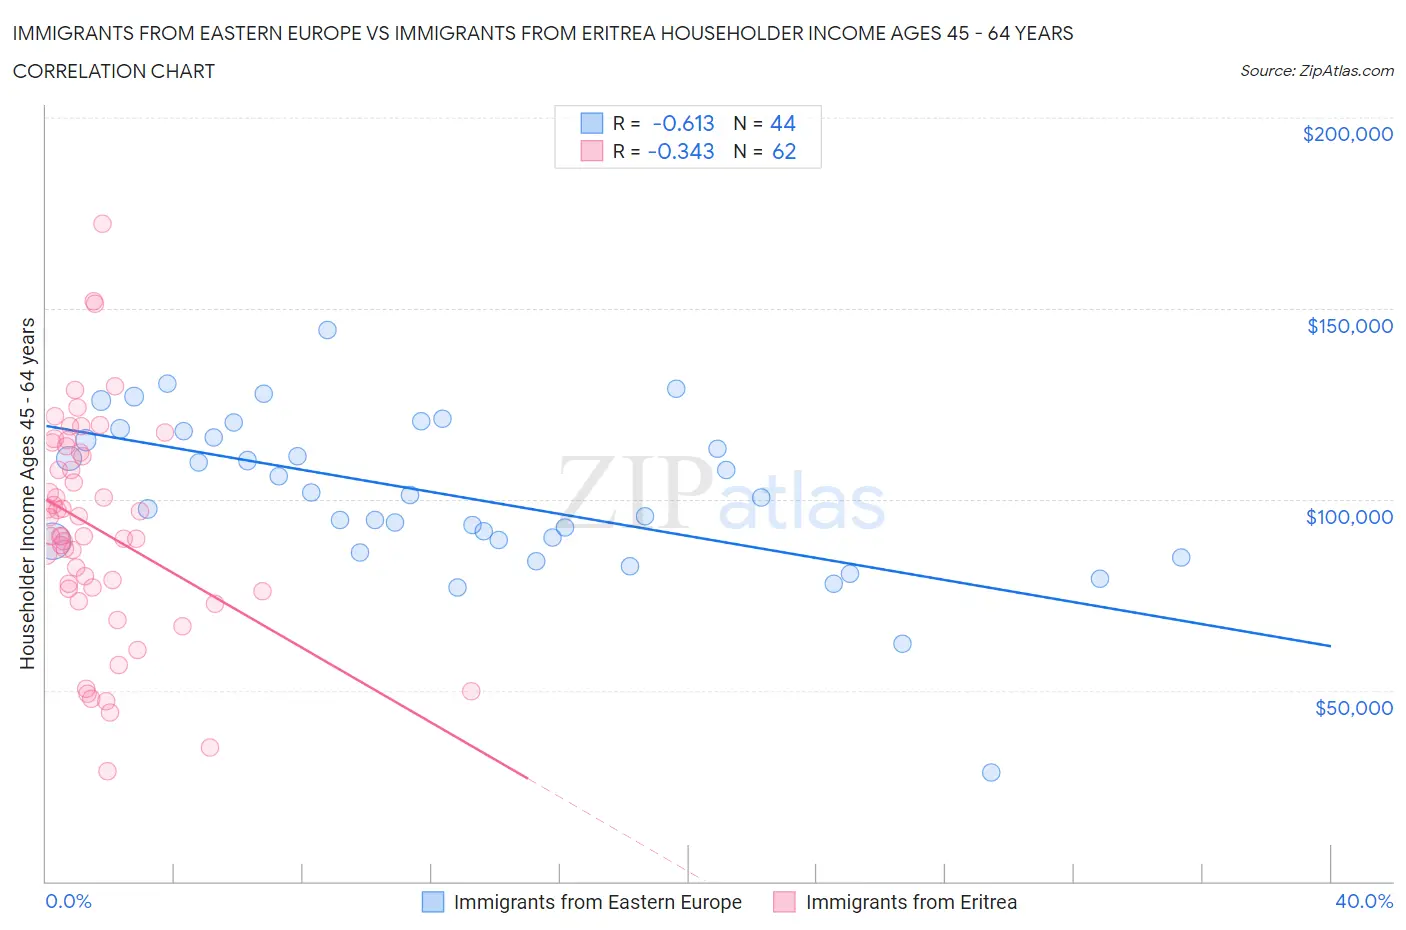
Immigrants from Eastern Europe vs Immigrants from Eritrea Householder Income Ages 45 - 64 years Correlation Chart
The statistical analysis conducted on geographies consisting of 474,661,335 people shows a significant negative correlation between the proportion of Immigrants from Eastern Europe and household income with householder between the ages 45 and 64 in the United States with a correlation coefficient (R) of -0.613 and weighted average of $109,335. Similarly, the statistical analysis conducted on geographies consisting of 104,839,257 people shows a mild negative correlation between the proportion of Immigrants from Eritrea and household income with householder between the ages 45 and 64 in the United States with a correlation coefficient (R) of -0.343 and weighted average of $97,373, a difference of 12.3%.
Householder Income Ages 45 - 64 years Correlation Summary
| Measurement | Immigrants from Eastern Europe | Immigrants from Eritrea |
| Minimum | $28,542 | $28,839 |
| Maximum | $144,195 | $172,216 |
| Range | $115,653 | $143,377 |
| Mean | $101,147 | $92,178 |
| Median | $100,823 | $90,363 |
| Interquartile 25% (IQ1) | $89,240 | $76,571 |
| Interquartile 75% (IQ3) | $117,050 | $112,271 |
| Interquartile Range (IQR) | $27,809 | $35,701 |
| Standard Deviation (Sample) | $20,985 | $28,505 |
| Standard Deviation (Population) | $20,746 | $28,274 |
Similar Demographics by Householder Income Ages 45 - 64 years
Demographics Similar to Immigrants from Eastern Europe by Householder Income Ages 45 - 64 years
In terms of householder income ages 45 - 64 years, the demographic groups most similar to Immigrants from Eastern Europe are Immigrants from Bulgaria ($109,379, a difference of 0.040%), Jordanian ($109,376, a difference of 0.040%), Immigrants from Canada ($109,402, a difference of 0.060%), Paraguayan ($109,447, a difference of 0.10%), and Immigrants from England ($109,446, a difference of 0.10%).
| Demographics | Rating | Rank | Householder Income Ages 45 - 64 years |
| Immigrants | Egypt | 99.2 /100 | #74 | Exceptional $109,941 |
| South Africans | 99.1 /100 | #75 | Exceptional $109,719 |
| Paraguayans | 99.0 /100 | #76 | Exceptional $109,447 |
| Immigrants | England | 99.0 /100 | #77 | Exceptional $109,446 |
| Immigrants | Canada | 99.0 /100 | #78 | Exceptional $109,402 |
| Immigrants | Bulgaria | 98.9 /100 | #79 | Exceptional $109,379 |
| Jordanians | 98.9 /100 | #80 | Exceptional $109,376 |
| Immigrants | Eastern Europe | 98.9 /100 | #81 | Exceptional $109,335 |
| Immigrants | North America | 98.8 /100 | #82 | Exceptional $109,198 |
| Immigrants | Spain | 98.8 /100 | #83 | Exceptional $109,051 |
| Immigrants | Western Europe | 98.6 /100 | #84 | Exceptional $108,824 |
| Immigrants | Afghanistan | 98.6 /100 | #85 | Exceptional $108,785 |
| Austrians | 98.5 /100 | #86 | Exceptional $108,692 |
| Tongans | 98.5 /100 | #87 | Exceptional $108,643 |
| Romanians | 98.5 /100 | #88 | Exceptional $108,609 |
Demographics Similar to Immigrants from Eritrea by Householder Income Ages 45 - 64 years
In terms of householder income ages 45 - 64 years, the demographic groups most similar to Immigrants from Eritrea are Immigrants from Thailand ($97,400, a difference of 0.030%), Tlingit-Haida ($97,417, a difference of 0.040%), Immigrants from Colombia ($97,290, a difference of 0.090%), Immigrants from Africa ($97,284, a difference of 0.090%), and Ghanaian ($97,277, a difference of 0.10%).
| Demographics | Rating | Rank | Householder Income Ages 45 - 64 years |
| Puget Sound Salish | 27.0 /100 | #197 | Fair $98,340 |
| Immigrants | Iraq | 25.7 /100 | #198 | Fair $98,201 |
| Whites/Caucasians | 24.6 /100 | #199 | Fair $98,091 |
| Immigrants | Kenya | 23.5 /100 | #200 | Fair $97,964 |
| Yugoslavians | 20.0 /100 | #201 | Fair $97,558 |
| Tlingit-Haida | 18.9 /100 | #202 | Poor $97,417 |
| Immigrants | Thailand | 18.8 /100 | #203 | Poor $97,400 |
| Immigrants | Eritrea | 18.6 /100 | #204 | Poor $97,373 |
| Immigrants | Colombia | 18.0 /100 | #205 | Poor $97,290 |
| Immigrants | Africa | 17.9 /100 | #206 | Poor $97,284 |
| Ghanaians | 17.9 /100 | #207 | Poor $97,277 |
| Scotch-Irish | 16.4 /100 | #208 | Poor $97,073 |
| Japanese | 14.8 /100 | #209 | Poor $96,834 |
| Tsimshian | 14.5 /100 | #210 | Poor $96,783 |
| Immigrants | Cambodia | 13.0 /100 | #211 | Poor $96,537 |