Carpatho Rusyn vs Immigrants from Ecuador Median Household Income
COMPARE
Carpatho Rusyn
Immigrants from Ecuador
Median Household Income
Median Household Income Comparison
Carpatho Rusyns
Immigrants from Ecuador
$86,635
MEDIAN HOUSEHOLD INCOME
72.8/ 100
METRIC RATING
155th/ 347
METRIC RANK
$80,341
MEDIAN HOUSEHOLD INCOME
4.5/ 100
METRIC RATING
234th/ 347
METRIC RANK
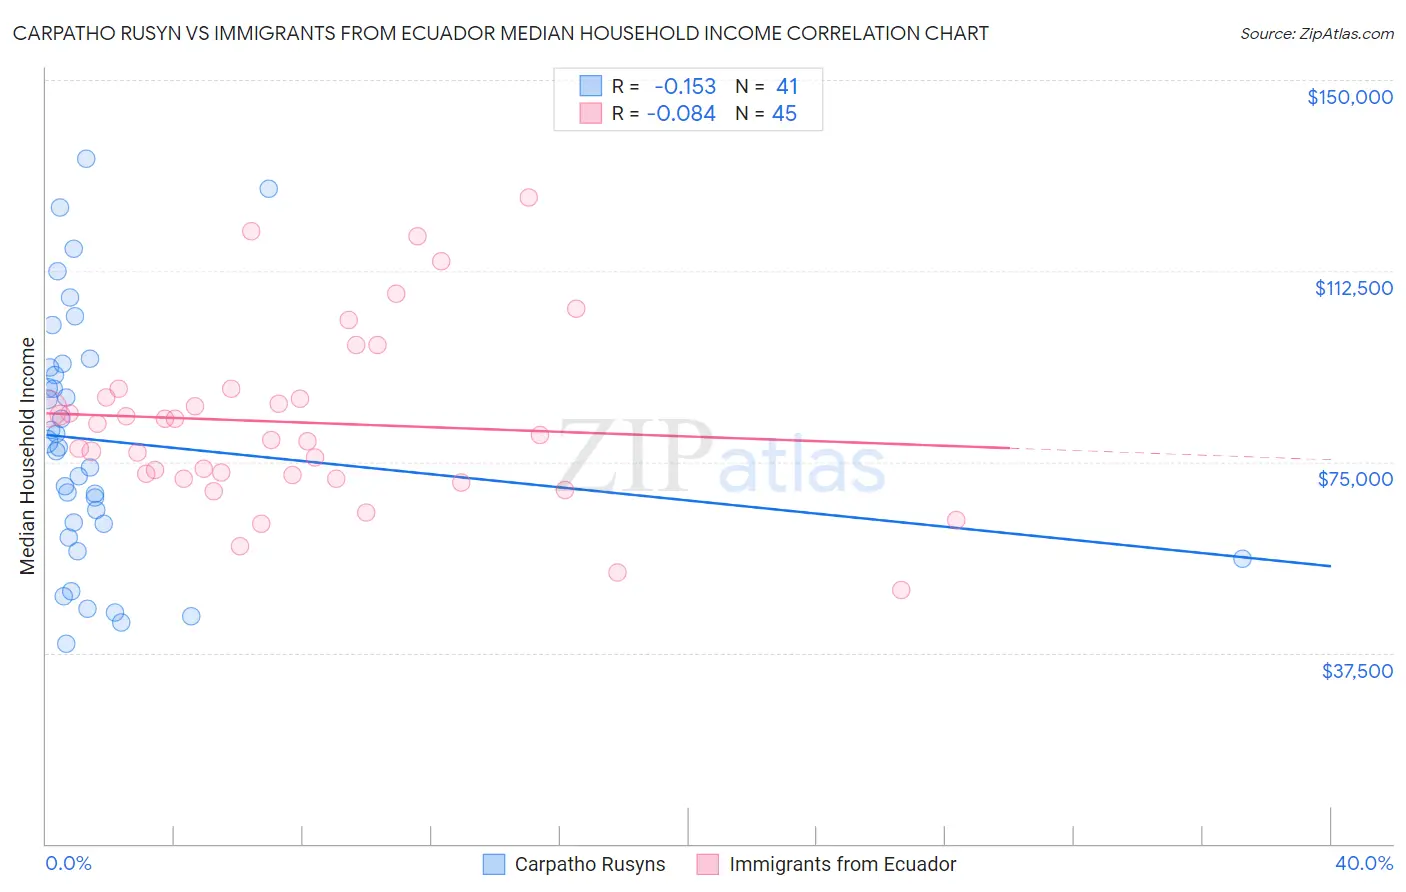
Carpatho Rusyn vs Immigrants from Ecuador Median Household Income Correlation Chart
The statistical analysis conducted on geographies consisting of 58,866,106 people shows a poor negative correlation between the proportion of Carpatho Rusyns and median household income in the United States with a correlation coefficient (R) of -0.153 and weighted average of $86,635. Similarly, the statistical analysis conducted on geographies consisting of 270,856,843 people shows a slight negative correlation between the proportion of Immigrants from Ecuador and median household income in the United States with a correlation coefficient (R) of -0.084 and weighted average of $80,341, a difference of 7.8%.
Median Household Income Correlation Summary
| Measurement | Carpatho Rusyn | Immigrants from Ecuador |
| Minimum | $39,318 | $49,886 |
| Maximum | $134,440 | $126,873 |
| Range | $95,122 | $76,987 |
| Mean | $79,082 | $82,745 |
| Median | $77,705 | $80,365 |
| Interquartile 25% (IQ1) | $61,521 | $72,009 |
| Interquartile 75% (IQ3) | $93,841 | $88,454 |
| Interquartile Range (IQR) | $32,321 | $16,444 |
| Standard Deviation (Sample) | $24,465 | $17,127 |
| Standard Deviation (Population) | $24,165 | $16,935 |
Similar Demographics by Median Household Income
Demographics Similar to Carpatho Rusyns by Median Household Income
In terms of median household income, the demographic groups most similar to Carpatho Rusyns are Immigrants from Albania ($86,534, a difference of 0.12%), Immigrants from Germany ($86,764, a difference of 0.15%), Samoan ($86,498, a difference of 0.16%), Moroccan ($86,468, a difference of 0.19%), and South American ($86,824, a difference of 0.22%).
| Demographics | Rating | Rank | Median Household Income |
| Costa Ricans | 80.0 /100 | #148 | Excellent $87,262 |
| Immigrants | Nepal | 77.7 /100 | #149 | Good $87,046 |
| Basques | 77.2 /100 | #150 | Good $87,001 |
| Hungarians | 76.3 /100 | #151 | Good $86,920 |
| Immigrants | Saudi Arabia | 75.8 /100 | #152 | Good $86,875 |
| South Americans | 75.1 /100 | #153 | Good $86,824 |
| Immigrants | Germany | 74.4 /100 | #154 | Good $86,764 |
| Carpatho Rusyns | 72.8 /100 | #155 | Good $86,635 |
| Immigrants | Albania | 71.5 /100 | #156 | Good $86,534 |
| Samoans | 71.0 /100 | #157 | Good $86,498 |
| Moroccans | 70.6 /100 | #158 | Good $86,468 |
| Immigrants | Uzbekistan | 70.1 /100 | #159 | Good $86,425 |
| Luxembourgers | 70.0 /100 | #160 | Good $86,418 |
| Slavs | 69.7 /100 | #161 | Good $86,398 |
| Guamanians/Chamorros | 67.7 /100 | #162 | Good $86,255 |
Demographics Similar to Immigrants from Ecuador by Median Household Income
In terms of median household income, the demographic groups most similar to Immigrants from Ecuador are Immigrants from the Azores ($80,357, a difference of 0.020%), Immigrants from Guyana ($80,324, a difference of 0.020%), Immigrants from Trinidad and Tobago ($80,373, a difference of 0.040%), Bermudan ($80,406, a difference of 0.080%), and Trinidadian and Tobagonian ($80,402, a difference of 0.080%).
| Demographics | Rating | Rank | Median Household Income |
| Guyanese | 5.7 /100 | #227 | Tragic $80,734 |
| Immigrants | Bangladesh | 5.7 /100 | #228 | Tragic $80,722 |
| Delaware | 5.0 /100 | #229 | Tragic $80,527 |
| Bermudans | 4.7 /100 | #230 | Tragic $80,406 |
| Trinidadians and Tobagonians | 4.7 /100 | #231 | Tragic $80,402 |
| Immigrants | Trinidad and Tobago | 4.6 /100 | #232 | Tragic $80,373 |
| Immigrants | Azores | 4.5 /100 | #233 | Tragic $80,357 |
| Immigrants | Ecuador | 4.5 /100 | #234 | Tragic $80,341 |
| Immigrants | Guyana | 4.5 /100 | #235 | Tragic $80,324 |
| Immigrants | Bosnia and Herzegovina | 3.4 /100 | #236 | Tragic $79,888 |
| Nicaraguans | 3.1 /100 | #237 | Tragic $79,737 |
| Barbadians | 3.0 /100 | #238 | Tragic $79,664 |
| Alaska Natives | 2.7 /100 | #239 | Tragic $79,509 |
| Immigrants | Western Africa | 2.7 /100 | #240 | Tragic $79,490 |
| Immigrants | Nonimmigrants | 2.6 /100 | #241 | Tragic $79,429 |