Scandinavian vs Immigrants from Bolivia 2nd Grade
COMPARE
Scandinavian
Immigrants from Bolivia
2nd Grade
2nd Grade Comparison
Scandinavians
Immigrants from Bolivia
98.5%
2ND GRADE
100.0/ 100
METRIC RATING
33rd/ 347
METRIC RANK
97.4%
2ND GRADE
0.1/ 100
METRIC RATING
273rd/ 347
METRIC RANK
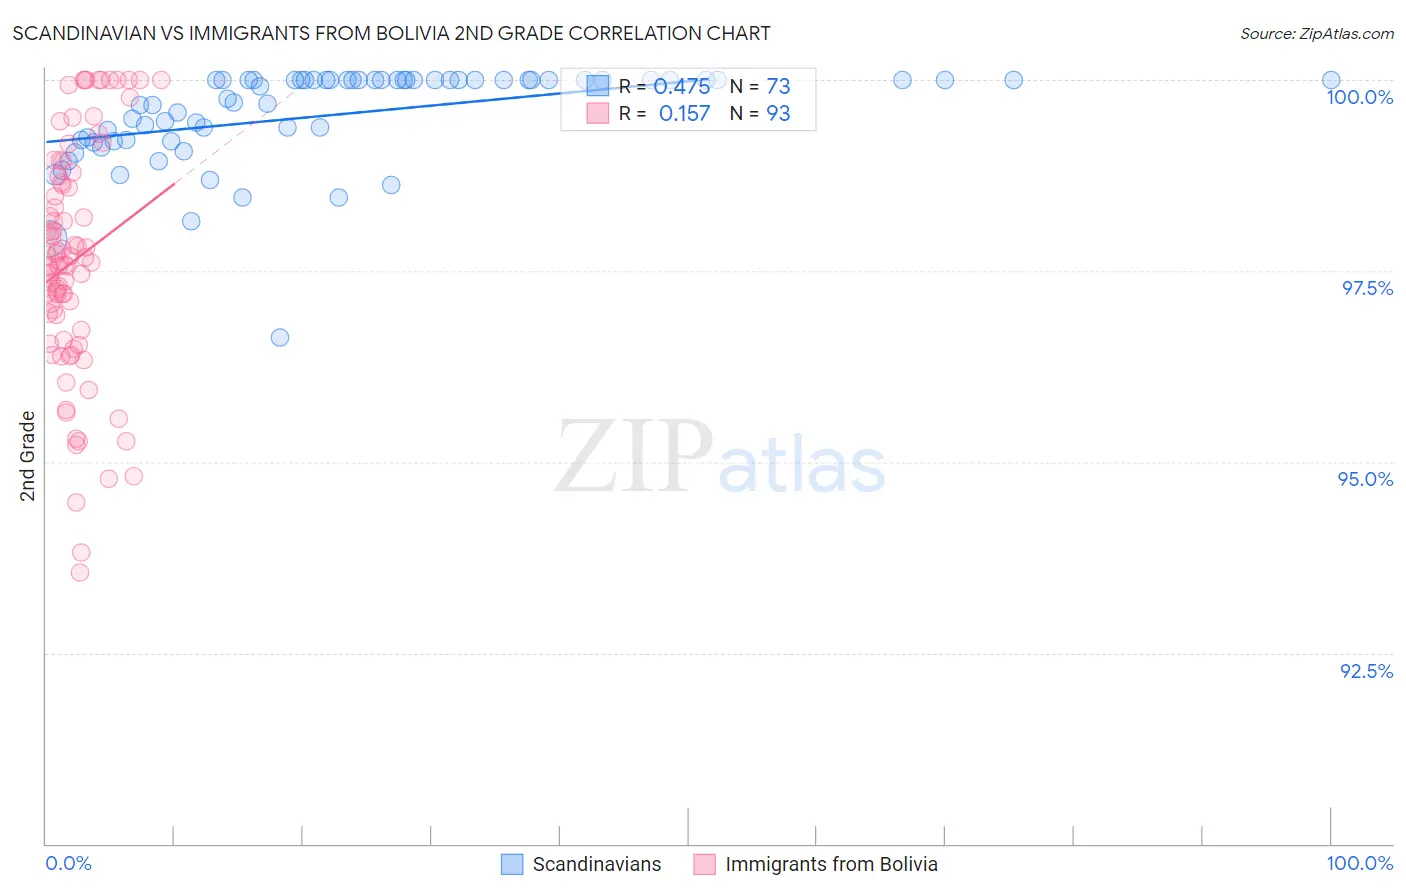
Scandinavian vs Immigrants from Bolivia 2nd Grade Correlation Chart
The statistical analysis conducted on geographies consisting of 472,660,430 people shows a moderate positive correlation between the proportion of Scandinavians and percentage of population with at least 2nd grade education in the United States with a correlation coefficient (R) of 0.475 and weighted average of 98.5%. Similarly, the statistical analysis conducted on geographies consisting of 158,719,692 people shows a poor positive correlation between the proportion of Immigrants from Bolivia and percentage of population with at least 2nd grade education in the United States with a correlation coefficient (R) of 0.157 and weighted average of 97.4%, a difference of 1.2%.
2nd Grade Correlation Summary
| Measurement | Scandinavian | Immigrants from Bolivia |
| Minimum | 96.6% | 93.6% |
| Maximum | 100.0% | 100.0% |
| Range | 3.4% | 6.4% |
| Mean | 99.5% | 97.6% |
| Median | 100.0% | 97.6% |
| Interquartile 25% (IQ1) | 99.2% | 96.7% |
| Interquartile 75% (IQ3) | 100.0% | 98.7% |
| Interquartile Range (IQR) | 0.79% | 2.0% |
| Standard Deviation (Sample) | 0.63% | 1.5% |
| Standard Deviation (Population) | 0.63% | 1.5% |
Similar Demographics by 2nd Grade
Demographics Similar to Scandinavians by 2nd Grade
In terms of 2nd grade, the demographic groups most similar to Scandinavians are French Canadian (98.5%, a difference of 0.0%), French (98.5%, a difference of 0.010%), European (98.5%, a difference of 0.010%), Czech (98.5%, a difference of 0.010%), and Croatian (98.5%, a difference of 0.020%).
| Demographics | Rating | Rank | 2nd Grade |
| Welsh | 100.0 /100 | #26 | Exceptional 98.5% |
| Croatians | 100.0 /100 | #27 | Exceptional 98.5% |
| Arapaho | 100.0 /100 | #28 | Exceptional 98.5% |
| French | 100.0 /100 | #29 | Exceptional 98.5% |
| Europeans | 100.0 /100 | #30 | Exceptional 98.5% |
| Czechs | 100.0 /100 | #31 | Exceptional 98.5% |
| French Canadians | 100.0 /100 | #32 | Exceptional 98.5% |
| Scandinavians | 100.0 /100 | #33 | Exceptional 98.5% |
| Chinese | 100.0 /100 | #34 | Exceptional 98.5% |
| Swiss | 100.0 /100 | #35 | Exceptional 98.5% |
| British | 100.0 /100 | #36 | Exceptional 98.5% |
| Italians | 99.9 /100 | #37 | Exceptional 98.4% |
| Latvians | 99.9 /100 | #38 | Exceptional 98.4% |
| Chippewa | 99.9 /100 | #39 | Exceptional 98.4% |
| Luxembourgers | 99.9 /100 | #40 | Exceptional 98.4% |
Demographics Similar to Immigrants from Bolivia by 2nd Grade
In terms of 2nd grade, the demographic groups most similar to Immigrants from Bolivia are Immigrants from Peru (97.4%, a difference of 0.010%), Ghanaian (97.4%, a difference of 0.010%), Immigrants from China (97.3%, a difference of 0.010%), Immigrants from Cameroon (97.4%, a difference of 0.020%), and Immigrants from Jamaica (97.4%, a difference of 0.040%).
| Demographics | Rating | Rank | 2nd Grade |
| Immigrants | Sierra Leone | 0.4 /100 | #266 | Tragic 97.4% |
| Cubans | 0.3 /100 | #267 | Tragic 97.4% |
| Immigrants | Nigeria | 0.3 /100 | #268 | Tragic 97.4% |
| West Indians | 0.3 /100 | #269 | Tragic 97.4% |
| Immigrants | Jamaica | 0.2 /100 | #270 | Tragic 97.4% |
| Immigrants | Cameroon | 0.2 /100 | #271 | Tragic 97.4% |
| Immigrants | Peru | 0.1 /100 | #272 | Tragic 97.4% |
| Immigrants | Bolivia | 0.1 /100 | #273 | Tragic 97.4% |
| Ghanaians | 0.1 /100 | #274 | Tragic 97.4% |
| Immigrants | China | 0.1 /100 | #275 | Tragic 97.3% |
| Immigrants | Philippines | 0.1 /100 | #276 | Tragic 97.3% |
| Immigrants | Western Africa | 0.1 /100 | #277 | Tragic 97.3% |
| Immigrants | Uzbekistan | 0.1 /100 | #278 | Tragic 97.3% |
| Immigrants | Ghana | 0.1 /100 | #279 | Tragic 97.3% |
| Afghans | 0.1 /100 | #280 | Tragic 97.3% |