Salvadoran vs Navajo Householder Income Ages 45 - 64 years
COMPARE
Salvadoran
Navajo
Householder Income Ages 45 - 64 years
Householder Income Ages 45 - 64 years Comparison
Salvadorans
Navajo
$94,842
HOUSEHOLDER INCOME AGES 45 - 64 YEARS
6.0/ 100
METRIC RATING
220th/ 347
METRIC RANK
$69,759
HOUSEHOLDER INCOME AGES 45 - 64 YEARS
0.0/ 100
METRIC RATING
345th/ 347
METRIC RANK
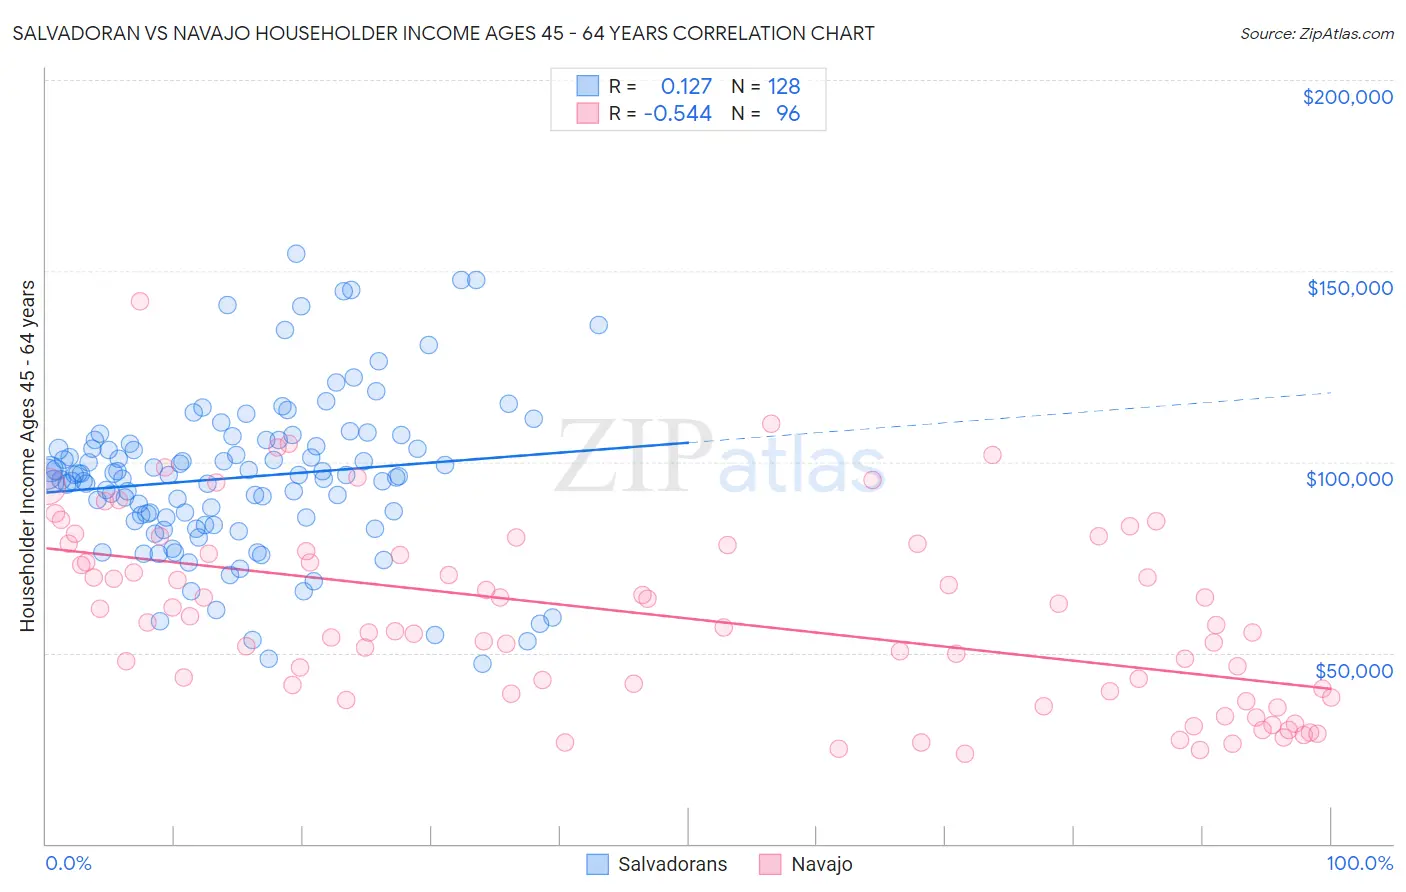
Salvadoran vs Navajo Householder Income Ages 45 - 64 years Correlation Chart
The statistical analysis conducted on geographies consisting of 398,191,339 people shows a poor positive correlation between the proportion of Salvadorans and household income with householder between the ages 45 and 64 in the United States with a correlation coefficient (R) of 0.127 and weighted average of $94,842. Similarly, the statistical analysis conducted on geographies consisting of 224,499,663 people shows a substantial negative correlation between the proportion of Navajo and household income with householder between the ages 45 and 64 in the United States with a correlation coefficient (R) of -0.544 and weighted average of $69,759, a difference of 36.0%.
Householder Income Ages 45 - 64 years Correlation Summary
| Measurement | Salvadoran | Navajo |
| Minimum | $47,083 | $23,688 |
| Maximum | $154,565 | $142,006 |
| Range | $107,482 | $118,318 |
| Mean | $95,925 | $59,518 |
| Median | $96,593 | $57,088 |
| Interquartile 25% (IQ1) | $84,940 | $39,664 |
| Interquartile 75% (IQ3) | $105,324 | $76,283 |
| Interquartile Range (IQR) | $20,384 | $36,618 |
| Standard Deviation (Sample) | $20,754 | $24,055 |
| Standard Deviation (Population) | $20,673 | $23,929 |
Similar Demographics by Householder Income Ages 45 - 64 years
Demographics Similar to Salvadorans by Householder Income Ages 45 - 64 years
In terms of householder income ages 45 - 64 years, the demographic groups most similar to Salvadorans are Immigrants from Armenia ($94,863, a difference of 0.020%), Immigrants from Nigeria ($94,804, a difference of 0.040%), Delaware ($94,914, a difference of 0.080%), Immigrants from Ghana ($94,982, a difference of 0.15%), and Malaysian ($94,517, a difference of 0.34%).
| Demographics | Rating | Rank | Householder Income Ages 45 - 64 years |
| Immigrants | Uruguay | 10.7 /100 | #213 | Poor $96,086 |
| Panamanians | 10.6 /100 | #214 | Poor $96,066 |
| Nigerians | 8.2 /100 | #215 | Tragic $95,492 |
| Immigrants | Venezuela | 7.6 /100 | #216 | Tragic $95,342 |
| Immigrants | Ghana | 6.4 /100 | #217 | Tragic $94,982 |
| Delaware | 6.2 /100 | #218 | Tragic $94,914 |
| Immigrants | Armenia | 6.1 /100 | #219 | Tragic $94,863 |
| Salvadorans | 6.0 /100 | #220 | Tragic $94,842 |
| Immigrants | Nigeria | 5.9 /100 | #221 | Tragic $94,804 |
| Malaysians | 5.2 /100 | #222 | Tragic $94,517 |
| Immigrants | Nonimmigrants | 5.0 /100 | #223 | Tragic $94,448 |
| Immigrants | Bosnia and Herzegovina | 4.6 /100 | #224 | Tragic $94,288 |
| Bermudans | 4.4 /100 | #225 | Tragic $94,197 |
| Immigrants | Azores | 4.3 /100 | #226 | Tragic $94,138 |
| Alaska Natives | 4.0 /100 | #227 | Tragic $93,991 |
Demographics Similar to Navajo by Householder Income Ages 45 - 64 years
In terms of householder income ages 45 - 64 years, the demographic groups most similar to Navajo are Puerto Rican ($69,234, a difference of 0.76%), Houma ($72,093, a difference of 3.4%), Pima ($73,365, a difference of 5.2%), Tohono O'odham ($73,774, a difference of 5.8%), and Crow ($74,257, a difference of 6.5%).
| Demographics | Rating | Rank | Householder Income Ages 45 - 64 years |
| Immigrants | Congo | 0.0 /100 | #333 | Tragic $77,850 |
| Menominee | 0.0 /100 | #334 | Tragic $76,903 |
| Cheyenne | 0.0 /100 | #335 | Tragic $76,362 |
| Arapaho | 0.0 /100 | #336 | Tragic $75,945 |
| Pueblo | 0.0 /100 | #337 | Tragic $75,601 |
| Hopi | 0.0 /100 | #338 | Tragic $75,562 |
| Kiowa | 0.0 /100 | #339 | Tragic $74,815 |
| Immigrants | Yemen | 0.0 /100 | #340 | Tragic $74,575 |
| Crow | 0.0 /100 | #341 | Tragic $74,257 |
| Tohono O'odham | 0.0 /100 | #342 | Tragic $73,774 |
| Pima | 0.0 /100 | #343 | Tragic $73,365 |
| Houma | 0.0 /100 | #344 | Tragic $72,093 |
| Navajo | 0.0 /100 | #345 | Tragic $69,759 |
| Puerto Ricans | 0.0 /100 | #346 | Tragic $69,234 |
| Lumbee | 0.0 /100 | #347 | Tragic $65,113 |