Salvadoran vs Immigrants from Eastern Africa Householder Income Ages 45 - 64 years
COMPARE
Salvadoran
Immigrants from Eastern Africa
Householder Income Ages 45 - 64 years
Householder Income Ages 45 - 64 years Comparison
Salvadorans
Immigrants from Eastern Africa
$94,842
HOUSEHOLDER INCOME AGES 45 - 64 YEARS
6.0/ 100
METRIC RATING
220th/ 347
METRIC RANK
$98,467
HOUSEHOLDER INCOME AGES 45 - 64 YEARS
28.3/ 100
METRIC RATING
196th/ 347
METRIC RANK
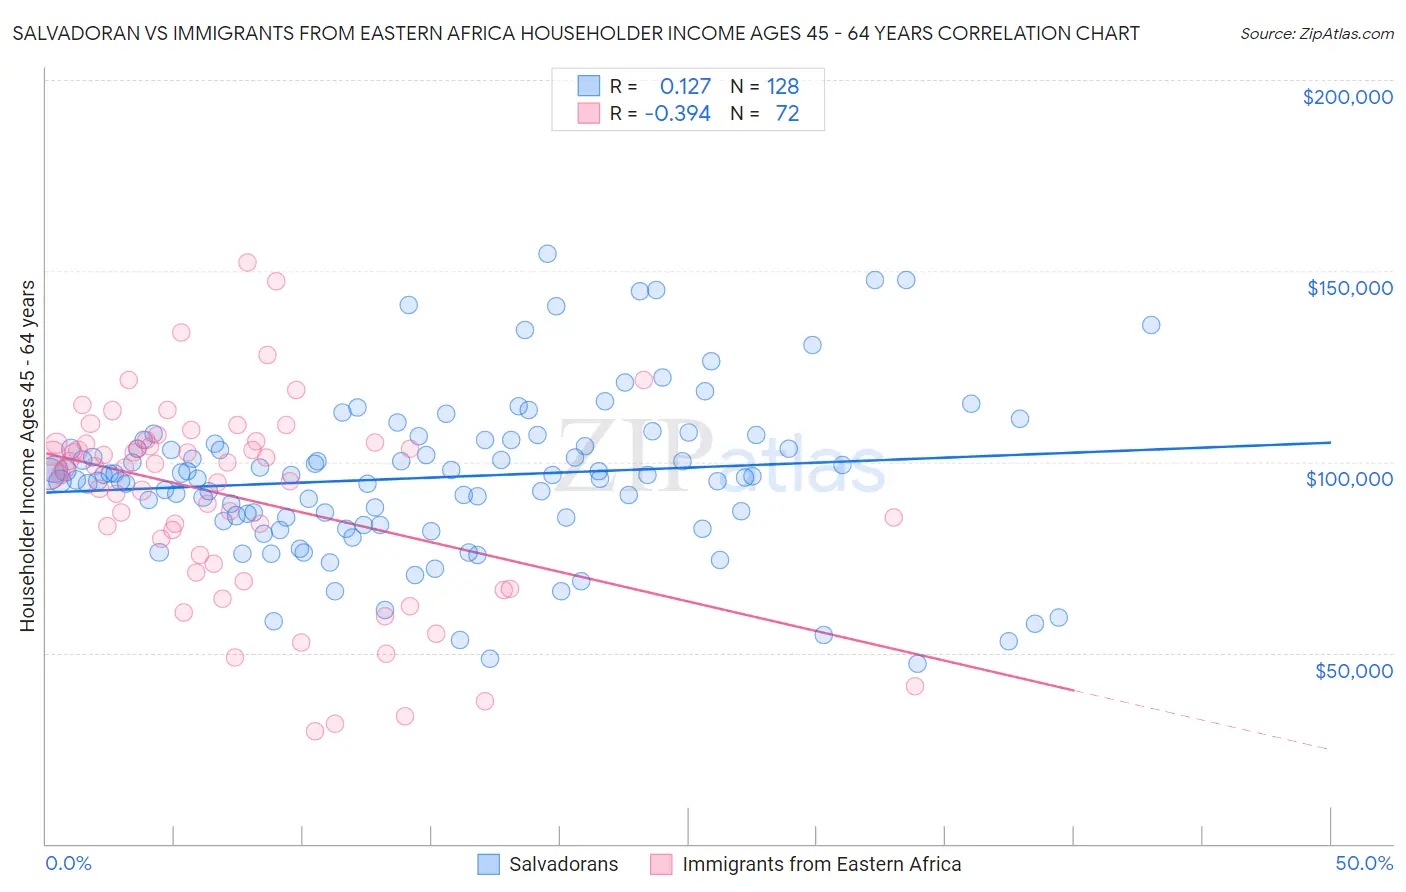
Salvadoran vs Immigrants from Eastern Africa Householder Income Ages 45 - 64 years Correlation Chart
The statistical analysis conducted on geographies consisting of 398,191,339 people shows a poor positive correlation between the proportion of Salvadorans and household income with householder between the ages 45 and 64 in the United States with a correlation coefficient (R) of 0.127 and weighted average of $94,842. Similarly, the statistical analysis conducted on geographies consisting of 354,576,754 people shows a mild negative correlation between the proportion of Immigrants from Eastern Africa and household income with householder between the ages 45 and 64 in the United States with a correlation coefficient (R) of -0.394 and weighted average of $98,467, a difference of 3.8%.
Householder Income Ages 45 - 64 years Correlation Summary
| Measurement | Salvadoran | Immigrants from Eastern Africa |
| Minimum | $47,083 | $29,590 |
| Maximum | $154,565 | $152,098 |
| Range | $107,482 | $122,508 |
| Mean | $95,925 | $90,687 |
| Median | $96,593 | $98,438 |
| Interquartile 25% (IQ1) | $84,940 | $74,490 |
| Interquartile 75% (IQ3) | $105,324 | $104,938 |
| Interquartile Range (IQR) | $20,384 | $30,447 |
| Standard Deviation (Sample) | $20,754 | $25,936 |
| Standard Deviation (Population) | $20,673 | $25,755 |
Similar Demographics by Householder Income Ages 45 - 64 years
Demographics Similar to Salvadorans by Householder Income Ages 45 - 64 years
In terms of householder income ages 45 - 64 years, the demographic groups most similar to Salvadorans are Immigrants from Armenia ($94,863, a difference of 0.020%), Immigrants from Nigeria ($94,804, a difference of 0.040%), Delaware ($94,914, a difference of 0.080%), Immigrants from Ghana ($94,982, a difference of 0.15%), and Malaysian ($94,517, a difference of 0.34%).
| Demographics | Rating | Rank | Householder Income Ages 45 - 64 years |
| Immigrants | Uruguay | 10.7 /100 | #213 | Poor $96,086 |
| Panamanians | 10.6 /100 | #214 | Poor $96,066 |
| Nigerians | 8.2 /100 | #215 | Tragic $95,492 |
| Immigrants | Venezuela | 7.6 /100 | #216 | Tragic $95,342 |
| Immigrants | Ghana | 6.4 /100 | #217 | Tragic $94,982 |
| Delaware | 6.2 /100 | #218 | Tragic $94,914 |
| Immigrants | Armenia | 6.1 /100 | #219 | Tragic $94,863 |
| Salvadorans | 6.0 /100 | #220 | Tragic $94,842 |
| Immigrants | Nigeria | 5.9 /100 | #221 | Tragic $94,804 |
| Malaysians | 5.2 /100 | #222 | Tragic $94,517 |
| Immigrants | Nonimmigrants | 5.0 /100 | #223 | Tragic $94,448 |
| Immigrants | Bosnia and Herzegovina | 4.6 /100 | #224 | Tragic $94,288 |
| Bermudans | 4.4 /100 | #225 | Tragic $94,197 |
| Immigrants | Azores | 4.3 /100 | #226 | Tragic $94,138 |
| Alaska Natives | 4.0 /100 | #227 | Tragic $93,991 |
Demographics Similar to Immigrants from Eastern Africa by Householder Income Ages 45 - 64 years
In terms of householder income ages 45 - 64 years, the demographic groups most similar to Immigrants from Eastern Africa are Spanish ($98,554, a difference of 0.090%), Puget Sound Salish ($98,340, a difference of 0.13%), Uruguayan ($98,660, a difference of 0.20%), Immigrants from Iraq ($98,201, a difference of 0.27%), and Hawaiian ($98,778, a difference of 0.32%).
| Demographics | Rating | Rank | Householder Income Ages 45 - 64 years |
| Immigrants | South America | 35.4 /100 | #189 | Fair $99,126 |
| French Canadians | 35.1 /100 | #190 | Fair $99,093 |
| Kenyans | 33.7 /100 | #191 | Fair $98,970 |
| Celtics | 32.9 /100 | #192 | Fair $98,896 |
| Hawaiians | 31.6 /100 | #193 | Fair $98,778 |
| Uruguayans | 30.3 /100 | #194 | Fair $98,660 |
| Spanish | 29.2 /100 | #195 | Fair $98,554 |
| Immigrants | Eastern Africa | 28.3 /100 | #196 | Fair $98,467 |
| Puget Sound Salish | 27.0 /100 | #197 | Fair $98,340 |
| Immigrants | Iraq | 25.7 /100 | #198 | Fair $98,201 |
| Whites/Caucasians | 24.6 /100 | #199 | Fair $98,091 |
| Immigrants | Kenya | 23.5 /100 | #200 | Fair $97,964 |
| Yugoslavians | 20.0 /100 | #201 | Fair $97,558 |
| Tlingit-Haida | 18.9 /100 | #202 | Poor $97,417 |
| Immigrants | Thailand | 18.8 /100 | #203 | Poor $97,400 |