Salvadoran vs Immigrants from Honduras Median Male Earnings
COMPARE
Salvadoran
Immigrants from Honduras
Median Male Earnings
Median Male Earnings Comparison
Salvadorans
Immigrants from Honduras
$48,646
MEDIAN MALE EARNINGS
0.3/ 100
METRIC RATING
272nd/ 347
METRIC RANK
$45,787
MEDIAN MALE EARNINGS
0.0/ 100
METRIC RATING
320th/ 347
METRIC RANK
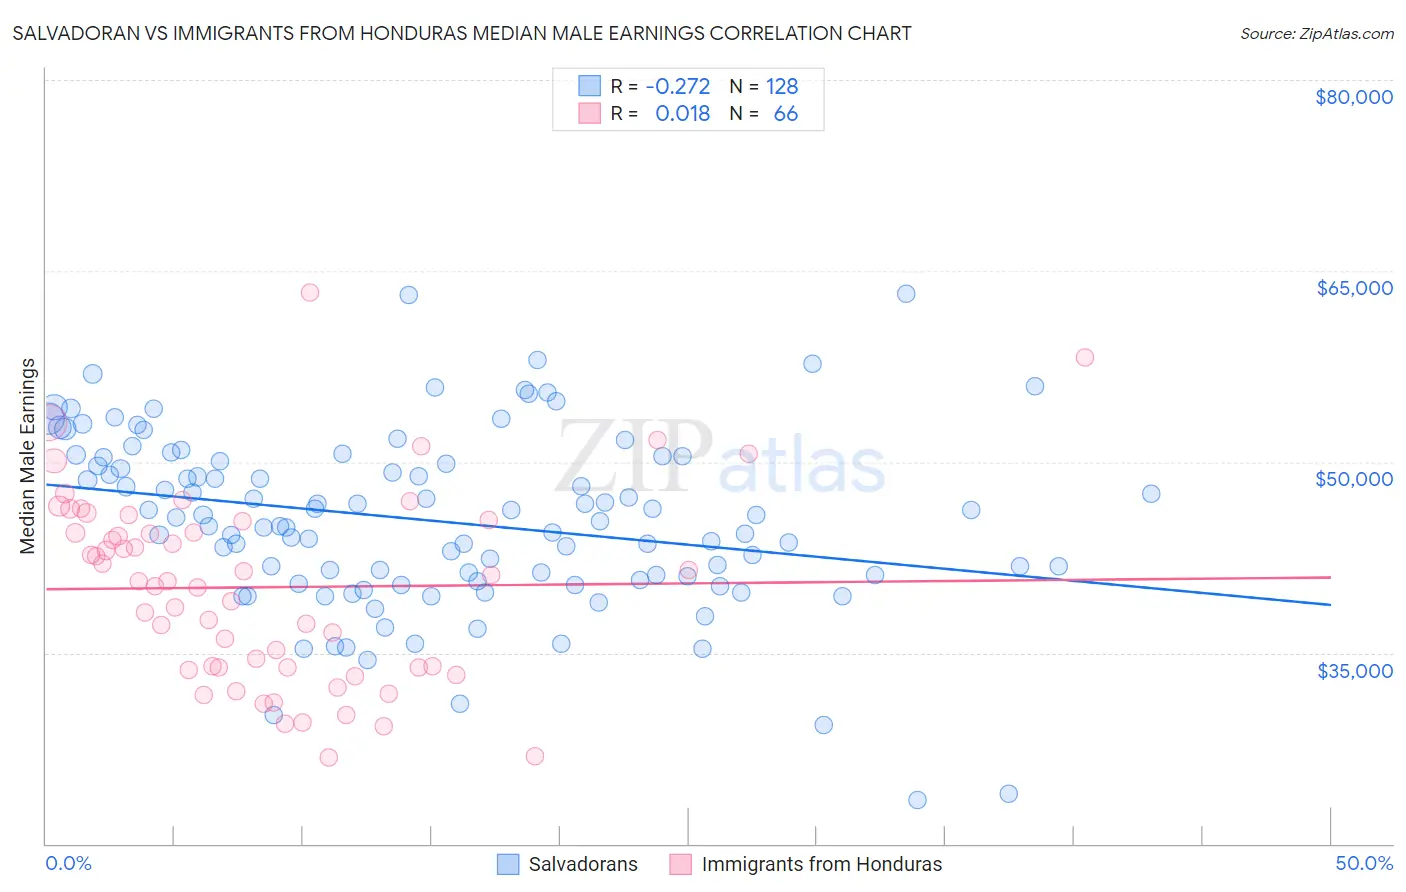
Salvadoran vs Immigrants from Honduras Median Male Earnings Correlation Chart
The statistical analysis conducted on geographies consisting of 398,918,079 people shows a weak negative correlation between the proportion of Salvadorans and median male earnings in the United States with a correlation coefficient (R) of -0.272 and weighted average of $48,646. Similarly, the statistical analysis conducted on geographies consisting of 322,554,949 people shows no correlation between the proportion of Immigrants from Honduras and median male earnings in the United States with a correlation coefficient (R) of 0.018 and weighted average of $45,787, a difference of 6.2%.
Median Male Earnings Correlation Summary
| Measurement | Salvadoran | Immigrants from Honduras |
| Minimum | $23,439 | $26,786 |
| Maximum | $63,214 | $63,286 |
| Range | $39,775 | $36,500 |
| Mean | $45,362 | $40,153 |
| Median | $45,515 | $40,629 |
| Interquartile 25% (IQ1) | $40,883 | $33,830 |
| Interquartile 75% (IQ3) | $50,182 | $45,376 |
| Interquartile Range (IQR) | $9,299 | $11,546 |
| Standard Deviation (Sample) | $7,004 | $7,556 |
| Standard Deviation (Population) | $6,977 | $7,498 |
Similar Demographics by Median Male Earnings
Demographics Similar to Salvadorans by Median Male Earnings
In terms of median male earnings, the demographic groups most similar to Salvadorans are Jamaican ($48,632, a difference of 0.030%), Cherokee ($48,669, a difference of 0.050%), Potawatomi ($48,768, a difference of 0.25%), Colville ($48,516, a difference of 0.27%), and Tsimshian ($48,836, a difference of 0.39%).
| Demographics | Rating | Rank | Median Male Earnings |
| Immigrants | Laos | 0.6 /100 | #265 | Tragic $49,190 |
| Somalis | 0.5 /100 | #266 | Tragic $49,025 |
| Spanish Americans | 0.5 /100 | #267 | Tragic $49,008 |
| Ute | 0.4 /100 | #268 | Tragic $48,899 |
| Tsimshian | 0.4 /100 | #269 | Tragic $48,836 |
| Potawatomi | 0.4 /100 | #270 | Tragic $48,768 |
| Cherokee | 0.3 /100 | #271 | Tragic $48,669 |
| Salvadorans | 0.3 /100 | #272 | Tragic $48,646 |
| Jamaicans | 0.3 /100 | #273 | Tragic $48,632 |
| Colville | 0.3 /100 | #274 | Tragic $48,516 |
| Immigrants | Somalia | 0.3 /100 | #275 | Tragic $48,439 |
| Blackfeet | 0.3 /100 | #276 | Tragic $48,402 |
| Belizeans | 0.2 /100 | #277 | Tragic $48,358 |
| Immigrants | Liberia | 0.2 /100 | #278 | Tragic $48,317 |
| Hmong | 0.2 /100 | #279 | Tragic $48,254 |
Demographics Similar to Immigrants from Honduras by Median Male Earnings
In terms of median male earnings, the demographic groups most similar to Immigrants from Honduras are Haitian ($45,903, a difference of 0.25%), Fijian ($45,607, a difference of 0.39%), Sioux ($45,566, a difference of 0.48%), Immigrants from Central America ($45,538, a difference of 0.55%), and Black/African American ($45,523, a difference of 0.58%).
| Demographics | Rating | Rank | Median Male Earnings |
| Hondurans | 0.0 /100 | #313 | Tragic $46,374 |
| Chippewa | 0.0 /100 | #314 | Tragic $46,368 |
| Immigrants | Guatemala | 0.0 /100 | #315 | Tragic $46,244 |
| Immigrants | Caribbean | 0.0 /100 | #316 | Tragic $46,193 |
| Mexicans | 0.0 /100 | #317 | Tragic $46,147 |
| Cheyenne | 0.0 /100 | #318 | Tragic $46,062 |
| Haitians | 0.0 /100 | #319 | Tragic $45,903 |
| Immigrants | Honduras | 0.0 /100 | #320 | Tragic $45,787 |
| Fijians | 0.0 /100 | #321 | Tragic $45,607 |
| Sioux | 0.0 /100 | #322 | Tragic $45,566 |
| Immigrants | Central America | 0.0 /100 | #323 | Tragic $45,538 |
| Blacks/African Americans | 0.0 /100 | #324 | Tragic $45,523 |
| Yuman | 0.0 /100 | #325 | Tragic $45,446 |
| Immigrants | Haiti | 0.0 /100 | #326 | Tragic $45,266 |
| Immigrants | Bahamas | 0.0 /100 | #327 | Tragic $45,176 |