Salvadoran vs Immigrants from Honduras 9th Grade
COMPARE
Salvadoran
Immigrants from Honduras
9th Grade
9th Grade Comparison
Salvadorans
Immigrants from Honduras
89.6%
9TH GRADE
0.0/ 100
METRIC RATING
342nd/ 347
METRIC RANK
90.6%
9TH GRADE
0.0/ 100
METRIC RATING
335th/ 347
METRIC RANK
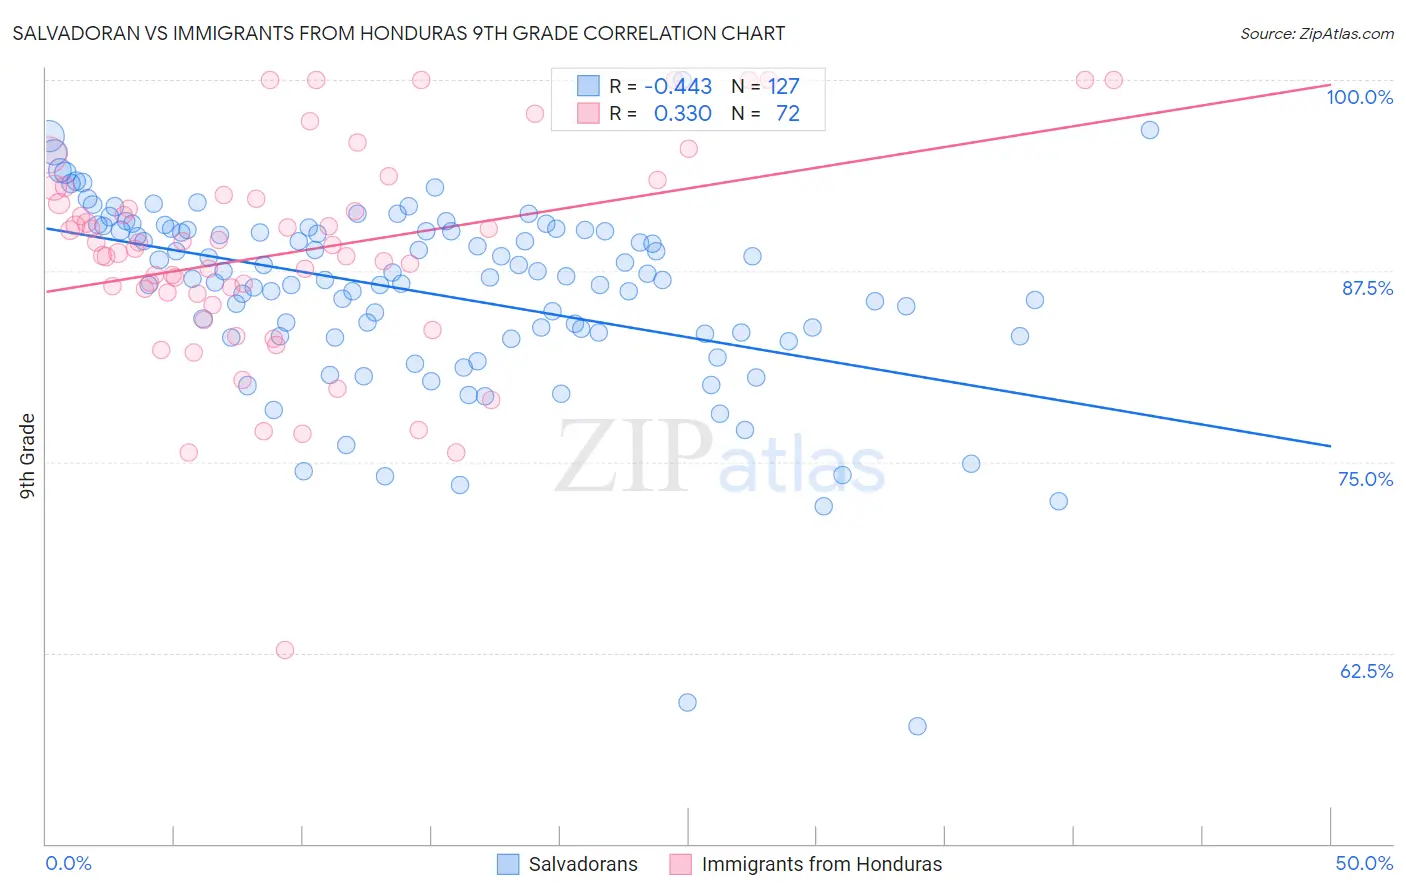
Salvadoran vs Immigrants from Honduras 9th Grade Correlation Chart
The statistical analysis conducted on geographies consisting of 399,034,410 people shows a moderate negative correlation between the proportion of Salvadorans and percentage of population with at least 9th grade education in the United States with a correlation coefficient (R) of -0.443 and weighted average of 89.6%. Similarly, the statistical analysis conducted on geographies consisting of 322,637,445 people shows a mild positive correlation between the proportion of Immigrants from Honduras and percentage of population with at least 9th grade education in the United States with a correlation coefficient (R) of 0.330 and weighted average of 90.6%, a difference of 1.1%.
9th Grade Correlation Summary
| Measurement | Salvadoran | Immigrants from Honduras |
| Minimum | 57.7% | 62.7% |
| Maximum | 100.0% | 100.0% |
| Range | 42.3% | 37.3% |
| Mean | 86.0% | 88.7% |
| Median | 87.0% | 89.1% |
| Interquartile 25% (IQ1) | 83.2% | 86.1% |
| Interquartile 75% (IQ3) | 90.2% | 92.3% |
| Interquartile Range (IQR) | 7.0% | 6.3% |
| Standard Deviation (Sample) | 6.4% | 7.0% |
| Standard Deviation (Population) | 6.3% | 6.9% |
Demographics Similar to Salvadorans and Immigrants from Honduras by 9th Grade
In terms of 9th grade, the demographic groups most similar to Salvadorans are Immigrants from Guatemala (89.4%, a difference of 0.20%), Guatemalan (89.9%, a difference of 0.31%), Mexican (90.0%, a difference of 0.43%), Yakama (90.1%, a difference of 0.49%), and Immigrants from El Salvador (89.0%, a difference of 0.71%). Similarly, the demographic groups most similar to Immigrants from Honduras are Immigrants from Dominican Republic (90.5%, a difference of 0.14%), Immigrants from the Azores (90.8%, a difference of 0.17%), Immigrants from Yemen (90.8%, a difference of 0.22%), Immigrants from Latin America (90.4%, a difference of 0.25%), and Central American (90.4%, a difference of 0.26%).
| Demographics | Rating | Rank | 9th Grade |
| Dominicans | 0.0 /100 | #328 | Tragic 91.1% |
| Hondurans | 0.0 /100 | #329 | Tragic 91.0% |
| Immigrants | Cabo Verde | 0.0 /100 | #330 | Tragic 90.9% |
| Mexican American Indians | 0.0 /100 | #331 | Tragic 90.9% |
| Hispanics or Latinos | 0.0 /100 | #332 | Tragic 90.9% |
| Immigrants | Yemen | 0.0 /100 | #333 | Tragic 90.8% |
| Immigrants | Azores | 0.0 /100 | #334 | Tragic 90.8% |
| Immigrants | Honduras | 0.0 /100 | #335 | Tragic 90.6% |
| Immigrants | Dominican Republic | 0.0 /100 | #336 | Tragic 90.5% |
| Immigrants | Latin America | 0.0 /100 | #337 | Tragic 90.4% |
| Central Americans | 0.0 /100 | #338 | Tragic 90.4% |
| Yakama | 0.0 /100 | #339 | Tragic 90.1% |
| Mexicans | 0.0 /100 | #340 | Tragic 90.0% |
| Guatemalans | 0.0 /100 | #341 | Tragic 89.9% |
| Salvadorans | 0.0 /100 | #342 | Tragic 89.6% |
| Immigrants | Guatemala | 0.0 /100 | #343 | Tragic 89.4% |
| Immigrants | El Salvador | 0.0 /100 | #344 | Tragic 89.0% |
| Immigrants | Central America | 0.0 /100 | #345 | Tragic 89.0% |
| Immigrants | Mexico | 0.0 /100 | #346 | Tragic 88.7% |
| Spanish American Indians | 0.0 /100 | #347 | Tragic 88.3% |