Russian vs Shoshone Median Family Income
COMPARE
Russian
Shoshone
Median Family Income
Median Family Income Comparison
Russians
Shoshone
$120,487
MEDIAN FAMILY INCOME
100.0/ 100
METRIC RATING
27th/ 347
METRIC RANK
$87,872
MEDIAN FAMILY INCOME
0.1/ 100
METRIC RATING
290th/ 347
METRIC RANK
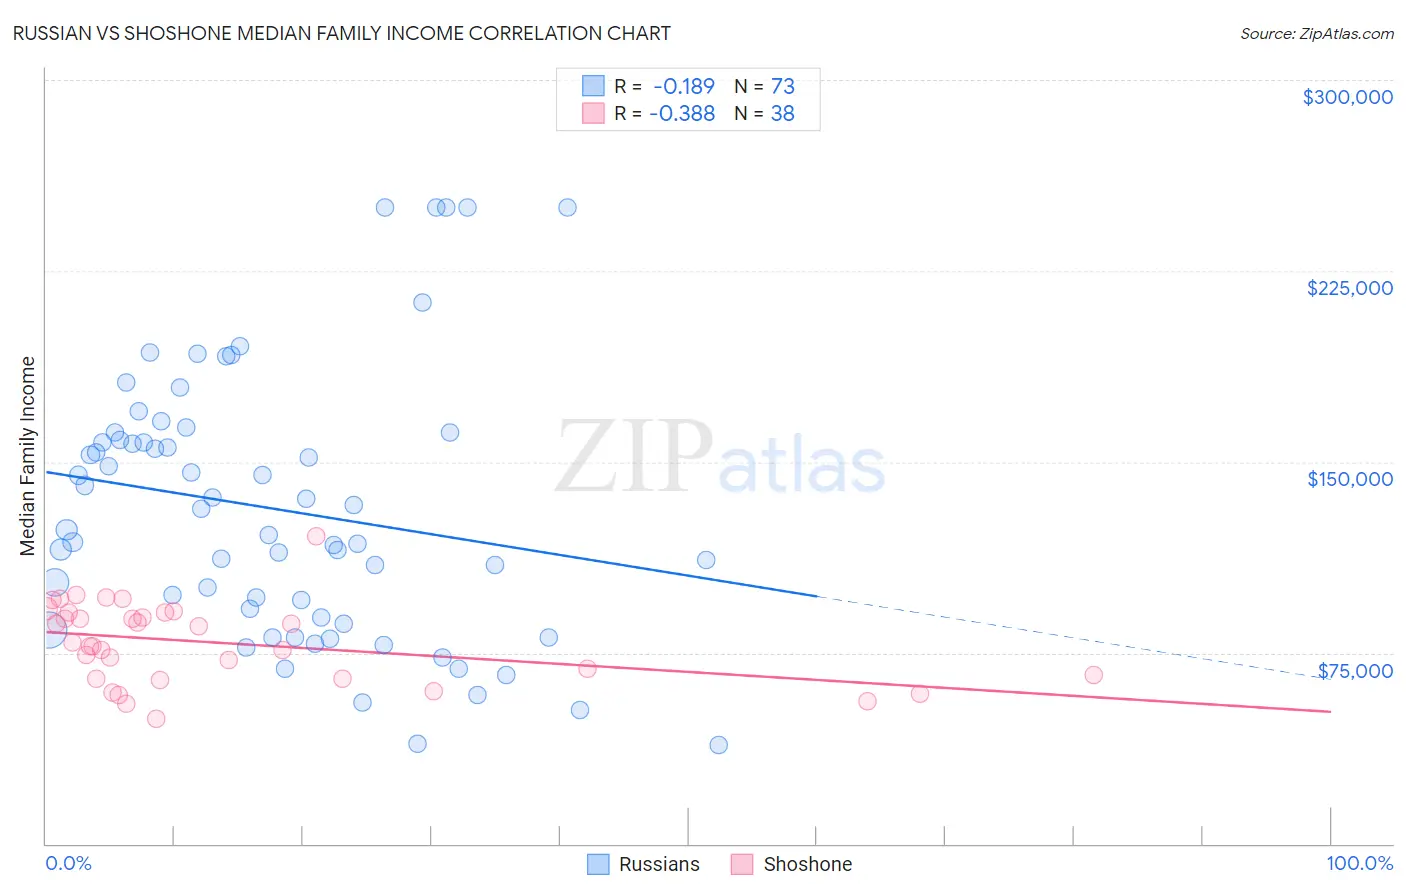
Russian vs Shoshone Median Family Income Correlation Chart
The statistical analysis conducted on geographies consisting of 511,404,289 people shows a poor negative correlation between the proportion of Russians and median family income in the United States with a correlation coefficient (R) of -0.189 and weighted average of $120,487. Similarly, the statistical analysis conducted on geographies consisting of 66,610,248 people shows a mild negative correlation between the proportion of Shoshone and median family income in the United States with a correlation coefficient (R) of -0.388 and weighted average of $87,872, a difference of 37.1%.
Median Family Income Correlation Summary
| Measurement | Russian | Shoshone |
| Minimum | $38,939 | $49,050 |
| Maximum | $250,001 | $121,000 |
| Range | $211,062 | $71,950 |
| Mean | $131,214 | $78,936 |
| Median | $123,457 | $78,378 |
| Interquartile 25% (IQ1) | $87,492 | $65,000 |
| Interquartile 75% (IQ3) | $160,004 | $90,917 |
| Interquartile Range (IQR) | $72,512 | $25,917 |
| Standard Deviation (Sample) | $52,364 | $15,660 |
| Standard Deviation (Population) | $52,005 | $15,453 |
Similar Demographics by Median Family Income
Demographics Similar to Russians by Median Family Income
In terms of median family income, the demographic groups most similar to Russians are Immigrants from Denmark ($120,445, a difference of 0.040%), Latvian ($120,301, a difference of 0.15%), Immigrants from Sri Lanka ($120,263, a difference of 0.19%), Immigrants from Switzerland ($120,726, a difference of 0.20%), and Immigrants from France ($120,076, a difference of 0.34%).
| Demographics | Rating | Rank | Median Family Income |
| Burmese | 100.0 /100 | #20 | Exceptional $123,369 |
| Immigrants | Korea | 100.0 /100 | #21 | Exceptional $122,800 |
| Immigrants | Sweden | 100.0 /100 | #22 | Exceptional $122,765 |
| Immigrants | Japan | 100.0 /100 | #23 | Exceptional $122,764 |
| Immigrants | Northern Europe | 100.0 /100 | #24 | Exceptional $121,840 |
| Turks | 100.0 /100 | #25 | Exceptional $121,202 |
| Immigrants | Switzerland | 100.0 /100 | #26 | Exceptional $120,726 |
| Russians | 100.0 /100 | #27 | Exceptional $120,487 |
| Immigrants | Denmark | 100.0 /100 | #28 | Exceptional $120,445 |
| Latvians | 100.0 /100 | #29 | Exceptional $120,301 |
| Immigrants | Sri Lanka | 100.0 /100 | #30 | Exceptional $120,263 |
| Immigrants | France | 100.0 /100 | #31 | Exceptional $120,076 |
| Asians | 100.0 /100 | #32 | Exceptional $119,955 |
| Bhutanese | 100.0 /100 | #33 | Exceptional $119,800 |
| Bolivians | 100.0 /100 | #34 | Exceptional $119,479 |
Demographics Similar to Shoshone by Median Family Income
In terms of median family income, the demographic groups most similar to Shoshone are Immigrants from Cabo Verde ($87,830, a difference of 0.050%), African ($87,820, a difference of 0.060%), Central American Indian ($88,034, a difference of 0.19%), Ute ($87,596, a difference of 0.32%), and Cherokee ($88,209, a difference of 0.38%).
| Demographics | Rating | Rank | Median Family Income |
| Bangladeshis | 0.1 /100 | #283 | Tragic $88,358 |
| Indonesians | 0.1 /100 | #284 | Tragic $88,301 |
| Guatemalans | 0.1 /100 | #285 | Tragic $88,295 |
| Immigrants | Nicaragua | 0.1 /100 | #286 | Tragic $88,267 |
| Potawatomi | 0.1 /100 | #287 | Tragic $88,265 |
| Cherokee | 0.1 /100 | #288 | Tragic $88,209 |
| Central American Indians | 0.1 /100 | #289 | Tragic $88,034 |
| Shoshone | 0.1 /100 | #290 | Tragic $87,872 |
| Immigrants | Cabo Verde | 0.1 /100 | #291 | Tragic $87,830 |
| Africans | 0.1 /100 | #292 | Tragic $87,820 |
| Ute | 0.0 /100 | #293 | Tragic $87,596 |
| Fijians | 0.0 /100 | #294 | Tragic $87,387 |
| Yaqui | 0.0 /100 | #295 | Tragic $87,289 |
| Immigrants | Guatemala | 0.0 /100 | #296 | Tragic $87,191 |
| Cajuns | 0.0 /100 | #297 | Tragic $87,157 |