Russian vs Fijian 9th Grade
COMPARE
Russian
Fijian
9th Grade
9th Grade Comparison
Russians
Fijians
96.0%
9TH GRADE
99.9/ 100
METRIC RATING
47th/ 347
METRIC RANK
93.1%
9TH GRADE
0.0/ 100
METRIC RATING
297th/ 347
METRIC RANK
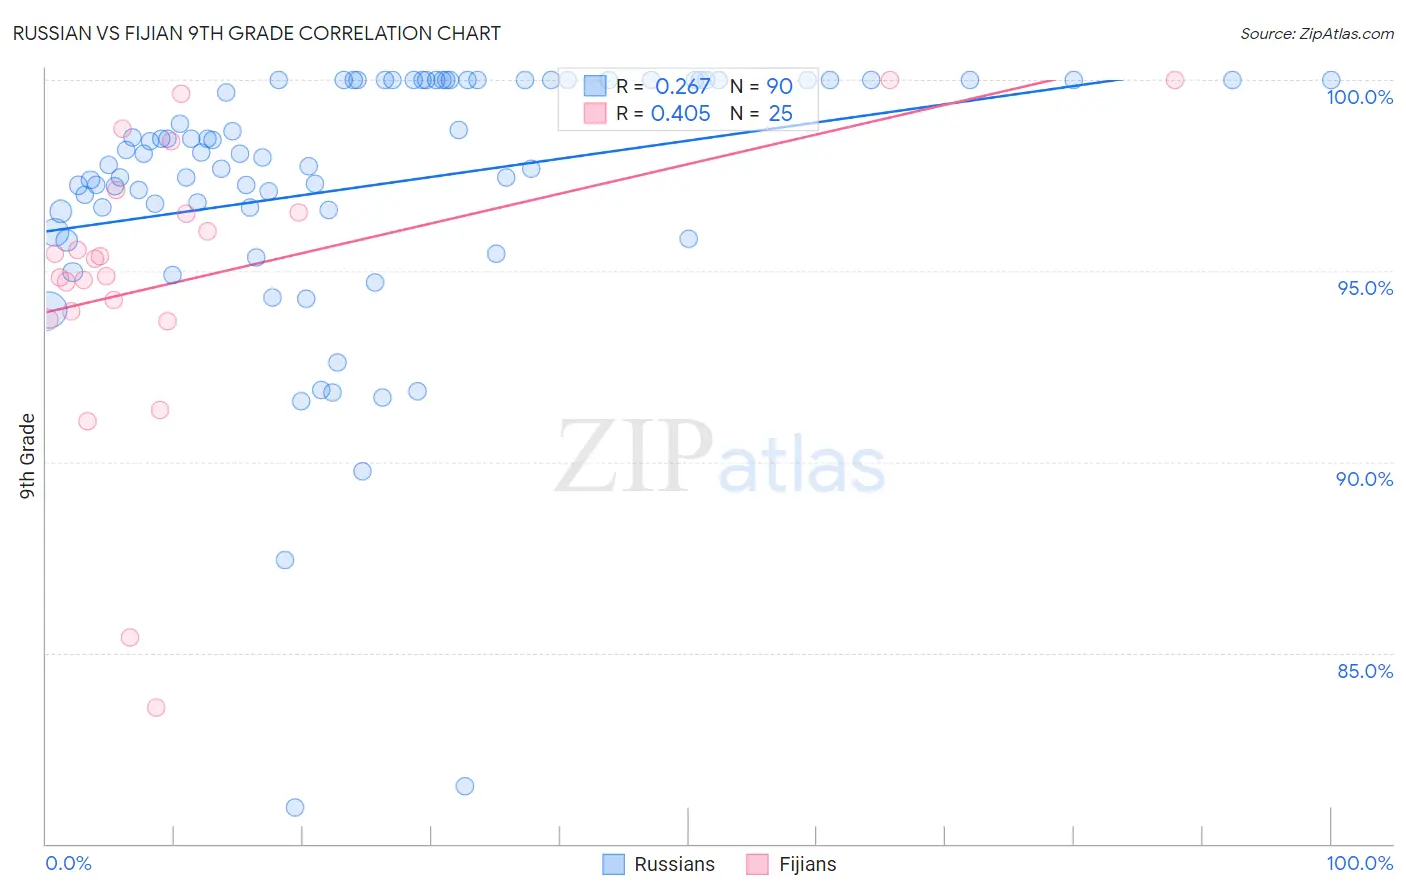
Russian vs Fijian 9th Grade Correlation Chart
The statistical analysis conducted on geographies consisting of 512,258,066 people shows a weak positive correlation between the proportion of Russians and percentage of population with at least 9th grade education in the United States with a correlation coefficient (R) of 0.267 and weighted average of 96.0%. Similarly, the statistical analysis conducted on geographies consisting of 55,948,842 people shows a moderate positive correlation between the proportion of Fijians and percentage of population with at least 9th grade education in the United States with a correlation coefficient (R) of 0.405 and weighted average of 93.1%, a difference of 3.2%.
9th Grade Correlation Summary
| Measurement | Russian | Fijian |
| Minimum | 81.0% | 83.6% |
| Maximum | 100.0% | 100.0% |
| Range | 19.0% | 16.4% |
| Mean | 97.2% | 94.8% |
| Median | 98.1% | 95.3% |
| Interquartile 25% (IQ1) | 96.6% | 93.8% |
| Interquartile 75% (IQ3) | 100.0% | 96.8% |
| Interquartile Range (IQR) | 3.4% | 3.0% |
| Standard Deviation (Sample) | 3.6% | 3.9% |
| Standard Deviation (Population) | 3.6% | 3.8% |
Similar Demographics by 9th Grade
Demographics Similar to Russians by 9th Grade
In terms of 9th grade, the demographic groups most similar to Russians are Australian (96.0%, a difference of 0.0%), Crow (96.1%, a difference of 0.010%), Immigrants from India (96.1%, a difference of 0.010%), Greek (96.0%, a difference of 0.010%), and Alaska Native (96.1%, a difference of 0.020%).
| Demographics | Rating | Rank | 9th Grade |
| Slavs | 99.9 /100 | #40 | Exceptional 96.1% |
| Czechoslovakians | 99.9 /100 | #41 | Exceptional 96.1% |
| Chippewa | 99.9 /100 | #42 | Exceptional 96.1% |
| Iranians | 99.9 /100 | #43 | Exceptional 96.1% |
| Alaska Natives | 99.9 /100 | #44 | Exceptional 96.1% |
| Crow | 99.9 /100 | #45 | Exceptional 96.1% |
| Immigrants | India | 99.9 /100 | #46 | Exceptional 96.1% |
| Russians | 99.9 /100 | #47 | Exceptional 96.0% |
| Australians | 99.9 /100 | #48 | Exceptional 96.0% |
| Greeks | 99.9 /100 | #49 | Exceptional 96.0% |
| Celtics | 99.9 /100 | #50 | Exceptional 96.0% |
| Immigrants | Northern Europe | 99.9 /100 | #51 | Exceptional 96.0% |
| Serbians | 99.9 /100 | #52 | Exceptional 96.0% |
| Austrians | 99.8 /100 | #53 | Exceptional 96.0% |
| Immigrants | Canada | 99.8 /100 | #54 | Exceptional 96.0% |
Demographics Similar to Fijians by 9th Grade
In terms of 9th grade, the demographic groups most similar to Fijians are Immigrants from Burma/Myanmar (93.1%, a difference of 0.030%), Indonesian (93.1%, a difference of 0.030%), Haitian (93.1%, a difference of 0.030%), Cuban (93.2%, a difference of 0.050%), and Sri Lankan (93.2%, a difference of 0.060%).
| Demographics | Rating | Rank | 9th Grade |
| Pennsylvania Germans | 0.0 /100 | #290 | Tragic 93.3% |
| British West Indians | 0.0 /100 | #291 | Tragic 93.2% |
| Immigrants | Laos | 0.0 /100 | #292 | Tragic 93.2% |
| Sri Lankans | 0.0 /100 | #293 | Tragic 93.2% |
| Cubans | 0.0 /100 | #294 | Tragic 93.2% |
| Immigrants | Burma/Myanmar | 0.0 /100 | #295 | Tragic 93.1% |
| Indonesians | 0.0 /100 | #296 | Tragic 93.1% |
| Fijians | 0.0 /100 | #297 | Tragic 93.1% |
| Haitians | 0.0 /100 | #298 | Tragic 93.1% |
| Immigrants | Grenada | 0.0 /100 | #299 | Tragic 93.0% |
| Yaqui | 0.0 /100 | #300 | Tragic 92.9% |
| Immigrants | Haiti | 0.0 /100 | #301 | Tragic 92.7% |
| Immigrants | Dominica | 0.0 /100 | #302 | Tragic 92.7% |
| Guyanese | 0.0 /100 | #303 | Tragic 92.7% |
| Tohono O'odham | 0.0 /100 | #304 | Tragic 92.6% |