Immigrants from Malaysia vs Arab Householder Income Ages 25 - 44 years
COMPARE
Immigrants from Malaysia
Arab
Householder Income Ages 25 - 44 years
Householder Income Ages 25 - 44 years Comparison
Immigrants from Malaysia
Arabs
$107,650
HOUSEHOLDER INCOME AGES 25 - 44 YEARS
99.9/ 100
METRIC RATING
43rd/ 347
METRIC RANK
$97,336
HOUSEHOLDER INCOME AGES 25 - 44 YEARS
82.3/ 100
METRIC RATING
138th/ 347
METRIC RANK
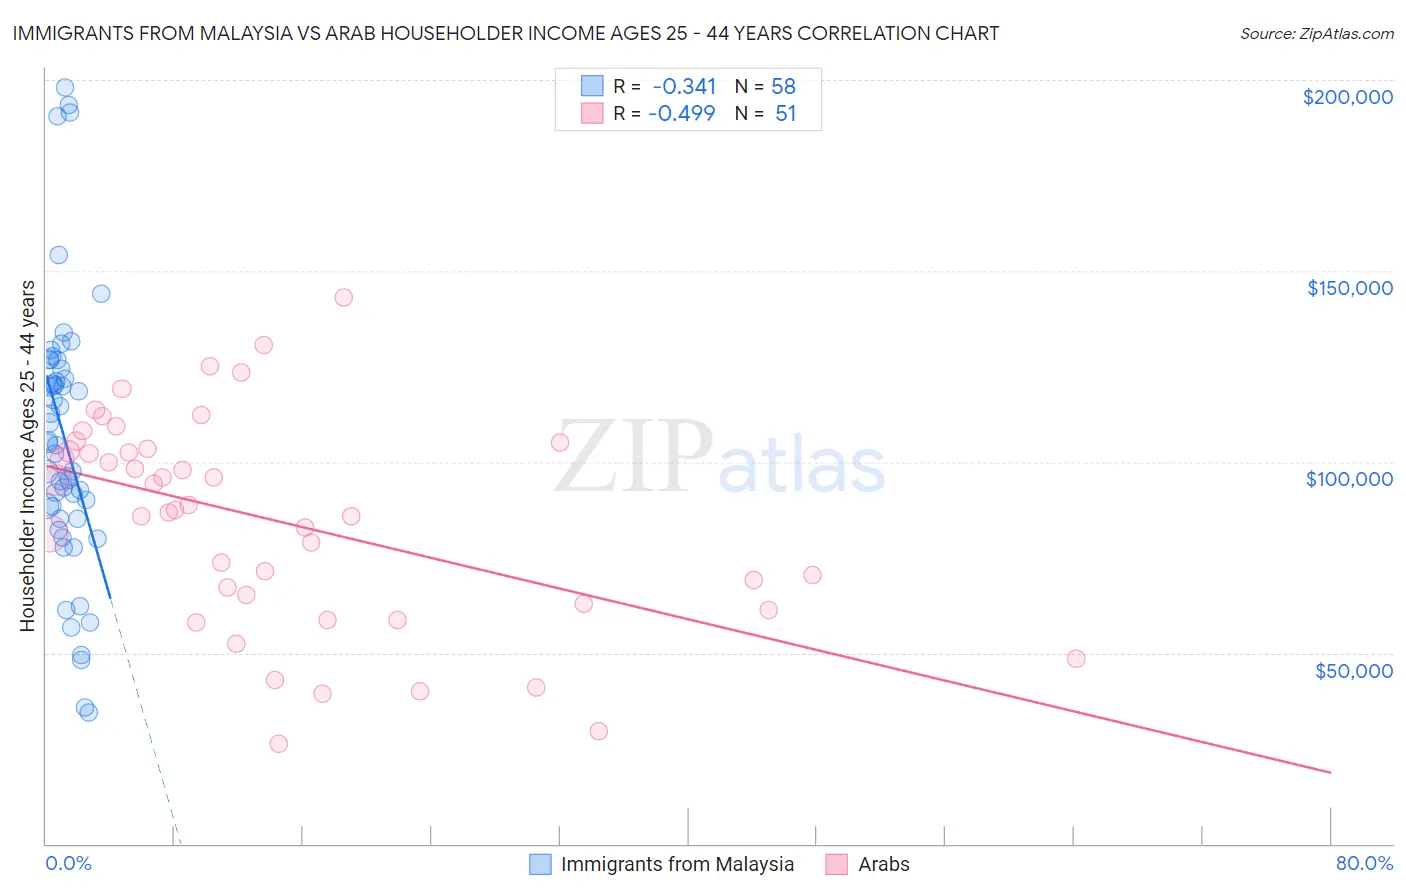
Immigrants from Malaysia vs Arab Householder Income Ages 25 - 44 years Correlation Chart
The statistical analysis conducted on geographies consisting of 197,845,248 people shows a mild negative correlation between the proportion of Immigrants from Malaysia and household income with householder between the ages 25 and 44 in the United States with a correlation coefficient (R) of -0.341 and weighted average of $107,650. Similarly, the statistical analysis conducted on geographies consisting of 484,835,242 people shows a moderate negative correlation between the proportion of Arabs and household income with householder between the ages 25 and 44 in the United States with a correlation coefficient (R) of -0.499 and weighted average of $97,336, a difference of 10.6%.
Householder Income Ages 25 - 44 years Correlation Summary
| Measurement | Immigrants from Malaysia | Arab |
| Minimum | $34,268 | $26,250 |
| Maximum | $197,953 | $143,125 |
| Range | $163,685 | $116,875 |
| Mean | $106,093 | $84,482 |
| Median | $104,675 | $87,286 |
| Interquartile 25% (IQ1) | $85,164 | $63,008 |
| Interquartile 75% (IQ3) | $124,430 | $103,414 |
| Interquartile Range (IQR) | $39,265 | $40,406 |
| Standard Deviation (Sample) | $35,722 | $27,531 |
| Standard Deviation (Population) | $35,413 | $27,260 |
Similar Demographics by Householder Income Ages 25 - 44 years
Demographics Similar to Immigrants from Malaysia by Householder Income Ages 25 - 44 years
In terms of householder income ages 25 - 44 years, the demographic groups most similar to Immigrants from Malaysia are Immigrants from Indonesia ($107,627, a difference of 0.020%), Israeli ($107,579, a difference of 0.070%), Australian ($107,912, a difference of 0.24%), Immigrants from Belarus ($107,393, a difference of 0.24%), and Estonian ($107,269, a difference of 0.36%).
| Demographics | Rating | Rank | Householder Income Ages 25 - 44 years |
| Latvians | 100.0 /100 | #36 | Exceptional $108,926 |
| Immigrants | Russia | 100.0 /100 | #37 | Exceptional $108,751 |
| Soviet Union | 100.0 /100 | #38 | Exceptional $108,457 |
| Immigrants | France | 99.9 /100 | #39 | Exceptional $108,257 |
| Immigrants | Lithuania | 99.9 /100 | #40 | Exceptional $108,149 |
| Immigrants | Bolivia | 99.9 /100 | #41 | Exceptional $108,128 |
| Australians | 99.9 /100 | #42 | Exceptional $107,912 |
| Immigrants | Malaysia | 99.9 /100 | #43 | Exceptional $107,650 |
| Immigrants | Indonesia | 99.9 /100 | #44 | Exceptional $107,627 |
| Israelis | 99.9 /100 | #45 | Exceptional $107,579 |
| Immigrants | Belarus | 99.9 /100 | #46 | Exceptional $107,393 |
| Estonians | 99.9 /100 | #47 | Exceptional $107,269 |
| Bulgarians | 99.9 /100 | #48 | Exceptional $107,264 |
| Immigrants | Turkey | 99.9 /100 | #49 | Exceptional $107,258 |
| Cambodians | 99.9 /100 | #50 | Exceptional $107,148 |
Demographics Similar to Arabs by Householder Income Ages 25 - 44 years
In terms of householder income ages 25 - 44 years, the demographic groups most similar to Arabs are Lebanese ($97,339, a difference of 0.0%), Immigrants from Peru ($97,329, a difference of 0.010%), Immigrants from Morocco ($97,305, a difference of 0.030%), Luxembourger ($97,237, a difference of 0.10%), and Danish ($97,221, a difference of 0.12%).
| Demographics | Rating | Rank | Householder Income Ages 25 - 44 years |
| Immigrants | Albania | 86.6 /100 | #131 | Excellent $97,929 |
| Immigrants | Zimbabwe | 86.3 /100 | #132 | Excellent $97,880 |
| Tsimshian | 85.8 /100 | #133 | Excellent $97,809 |
| Canadians | 84.5 /100 | #134 | Excellent $97,625 |
| Immigrants | Oceania | 84.5 /100 | #135 | Excellent $97,623 |
| Hungarians | 83.9 /100 | #136 | Excellent $97,544 |
| Lebanese | 82.3 /100 | #137 | Excellent $97,339 |
| Arabs | 82.3 /100 | #138 | Excellent $97,336 |
| Immigrants | Peru | 82.2 /100 | #139 | Excellent $97,329 |
| Immigrants | Morocco | 82.0 /100 | #140 | Excellent $97,305 |
| Luxembourgers | 81.5 /100 | #141 | Excellent $97,237 |
| Danes | 81.3 /100 | #142 | Excellent $97,221 |
| Immigrants | Jordan | 81.0 /100 | #143 | Excellent $97,185 |
| Immigrants | Chile | 80.8 /100 | #144 | Excellent $97,159 |
| Norwegians | 78.2 /100 | #145 | Good $96,866 |