Immigrants from Vietnam vs Arab Householder Income Ages 25 - 44 years
COMPARE
Immigrants from Vietnam
Arab
Householder Income Ages 25 - 44 years
Householder Income Ages 25 - 44 years Comparison
Immigrants from Vietnam
Arabs
$100,535
HOUSEHOLDER INCOME AGES 25 - 44 YEARS
96.5/ 100
METRIC RATING
105th/ 347
METRIC RANK
$97,336
HOUSEHOLDER INCOME AGES 25 - 44 YEARS
82.3/ 100
METRIC RATING
138th/ 347
METRIC RANK
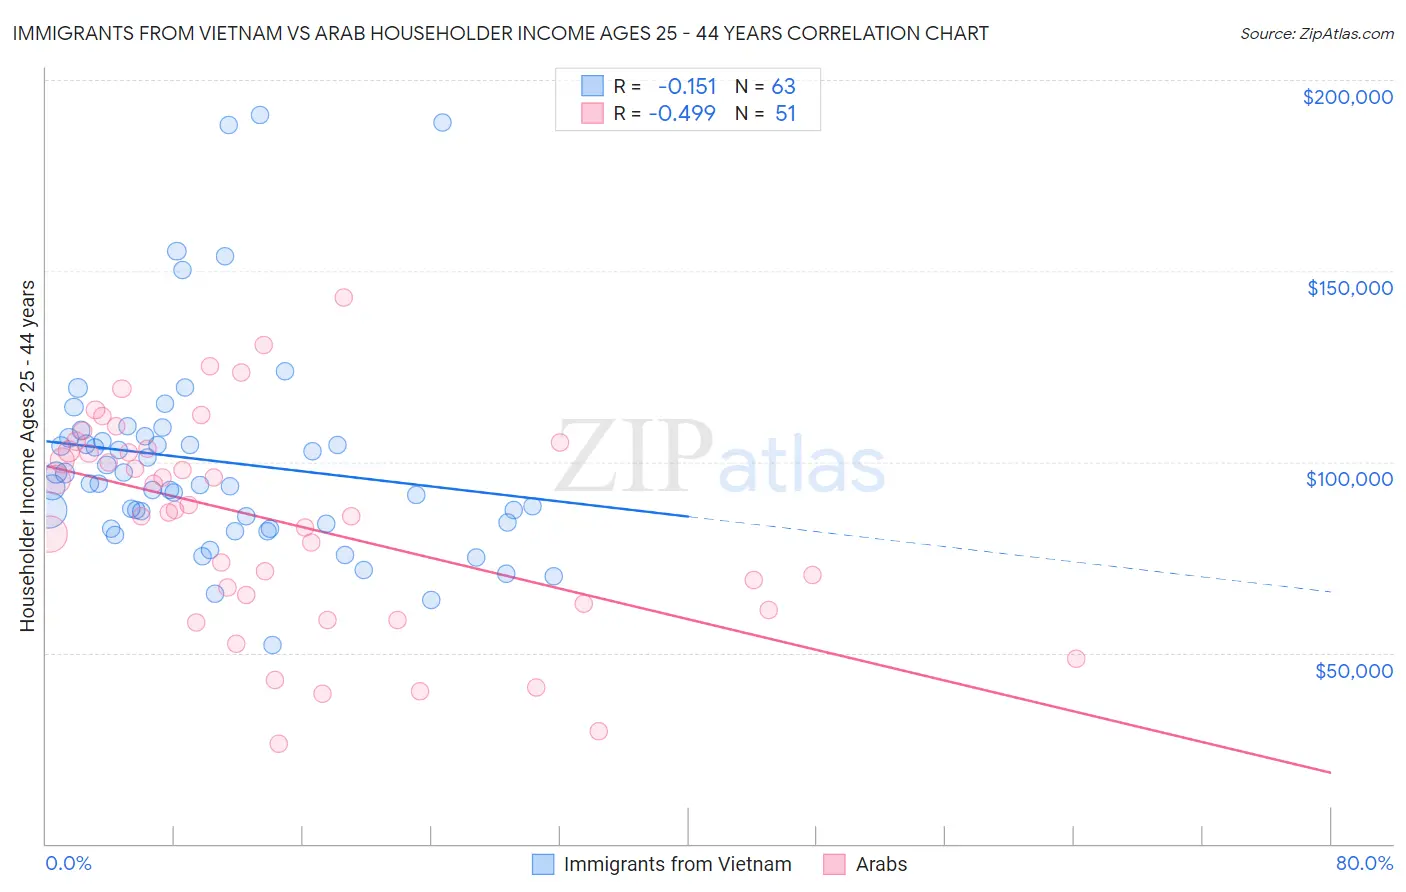
Immigrants from Vietnam vs Arab Householder Income Ages 25 - 44 years Correlation Chart
The statistical analysis conducted on geographies consisting of 403,588,460 people shows a poor negative correlation between the proportion of Immigrants from Vietnam and household income with householder between the ages 25 and 44 in the United States with a correlation coefficient (R) of -0.151 and weighted average of $100,535. Similarly, the statistical analysis conducted on geographies consisting of 484,835,242 people shows a moderate negative correlation between the proportion of Arabs and household income with householder between the ages 25 and 44 in the United States with a correlation coefficient (R) of -0.499 and weighted average of $97,336, a difference of 3.3%.
Householder Income Ages 25 - 44 years Correlation Summary
| Measurement | Immigrants from Vietnam | Arab |
| Minimum | $51,884 | $26,250 |
| Maximum | $190,804 | $143,125 |
| Range | $138,920 | $116,875 |
| Mean | $100,184 | $84,482 |
| Median | $94,148 | $87,286 |
| Interquartile 25% (IQ1) | $83,833 | $63,008 |
| Interquartile 75% (IQ3) | $106,342 | $103,414 |
| Interquartile Range (IQR) | $22,509 | $40,406 |
| Standard Deviation (Sample) | $27,886 | $27,531 |
| Standard Deviation (Population) | $27,664 | $27,260 |
Similar Demographics by Householder Income Ages 25 - 44 years
Demographics Similar to Immigrants from Vietnam by Householder Income Ages 25 - 44 years
In terms of householder income ages 25 - 44 years, the demographic groups most similar to Immigrants from Vietnam are Immigrants from Brazil ($100,534, a difference of 0.0%), Northern European ($100,457, a difference of 0.080%), Immigrants from South Eastern Asia ($100,283, a difference of 0.25%), Immigrants from North Macedonia ($100,101, a difference of 0.43%), and Immigrants from Poland ($101,065, a difference of 0.53%).
| Demographics | Rating | Rank | Householder Income Ages 25 - 44 years |
| Immigrants | Kazakhstan | 98.1 /100 | #98 | Exceptional $101,727 |
| Taiwanese | 97.9 /100 | #99 | Exceptional $101,492 |
| Immigrants | Argentina | 97.8 /100 | #100 | Exceptional $101,415 |
| Albanians | 97.8 /100 | #101 | Exceptional $101,367 |
| Immigrants | Lebanon | 97.4 /100 | #102 | Exceptional $101,124 |
| Immigrants | Moldova | 97.4 /100 | #103 | Exceptional $101,091 |
| Immigrants | Poland | 97.4 /100 | #104 | Exceptional $101,065 |
| Immigrants | Vietnam | 96.5 /100 | #105 | Exceptional $100,535 |
| Immigrants | Brazil | 96.5 /100 | #106 | Exceptional $100,534 |
| Northern Europeans | 96.3 /100 | #107 | Exceptional $100,457 |
| Immigrants | South Eastern Asia | 96.0 /100 | #108 | Exceptional $100,283 |
| Immigrants | North Macedonia | 95.6 /100 | #109 | Exceptional $100,101 |
| Immigrants | Afghanistan | 95.3 /100 | #110 | Exceptional $99,977 |
| Chileans | 95.1 /100 | #111 | Exceptional $99,900 |
| Poles | 94.5 /100 | #112 | Exceptional $99,685 |
Demographics Similar to Arabs by Householder Income Ages 25 - 44 years
In terms of householder income ages 25 - 44 years, the demographic groups most similar to Arabs are Lebanese ($97,339, a difference of 0.0%), Immigrants from Peru ($97,329, a difference of 0.010%), Immigrants from Morocco ($97,305, a difference of 0.030%), Luxembourger ($97,237, a difference of 0.10%), and Danish ($97,221, a difference of 0.12%).
| Demographics | Rating | Rank | Householder Income Ages 25 - 44 years |
| Immigrants | Albania | 86.6 /100 | #131 | Excellent $97,929 |
| Immigrants | Zimbabwe | 86.3 /100 | #132 | Excellent $97,880 |
| Tsimshian | 85.8 /100 | #133 | Excellent $97,809 |
| Canadians | 84.5 /100 | #134 | Excellent $97,625 |
| Immigrants | Oceania | 84.5 /100 | #135 | Excellent $97,623 |
| Hungarians | 83.9 /100 | #136 | Excellent $97,544 |
| Lebanese | 82.3 /100 | #137 | Excellent $97,339 |
| Arabs | 82.3 /100 | #138 | Excellent $97,336 |
| Immigrants | Peru | 82.2 /100 | #139 | Excellent $97,329 |
| Immigrants | Morocco | 82.0 /100 | #140 | Excellent $97,305 |
| Luxembourgers | 81.5 /100 | #141 | Excellent $97,237 |
| Danes | 81.3 /100 | #142 | Excellent $97,221 |
| Immigrants | Jordan | 81.0 /100 | #143 | Excellent $97,185 |
| Immigrants | Chile | 80.8 /100 | #144 | Excellent $97,159 |
| Norwegians | 78.2 /100 | #145 | Good $96,866 |