Immigrants from Bangladesh vs Immigrants from Laos Householder Income Over 65 years
COMPARE
Immigrants from Bangladesh
Immigrants from Laos
Householder Income Over 65 years
Householder Income Over 65 years Comparison
Immigrants from Bangladesh
Immigrants from Laos
$55,394
HOUSEHOLDER INCOME OVER 65 YEARS
0.3/ 100
METRIC RATING
255th/ 347
METRIC RANK
$56,722
HOUSEHOLDER INCOME OVER 65 YEARS
1.2/ 100
METRIC RATING
239th/ 347
METRIC RANK
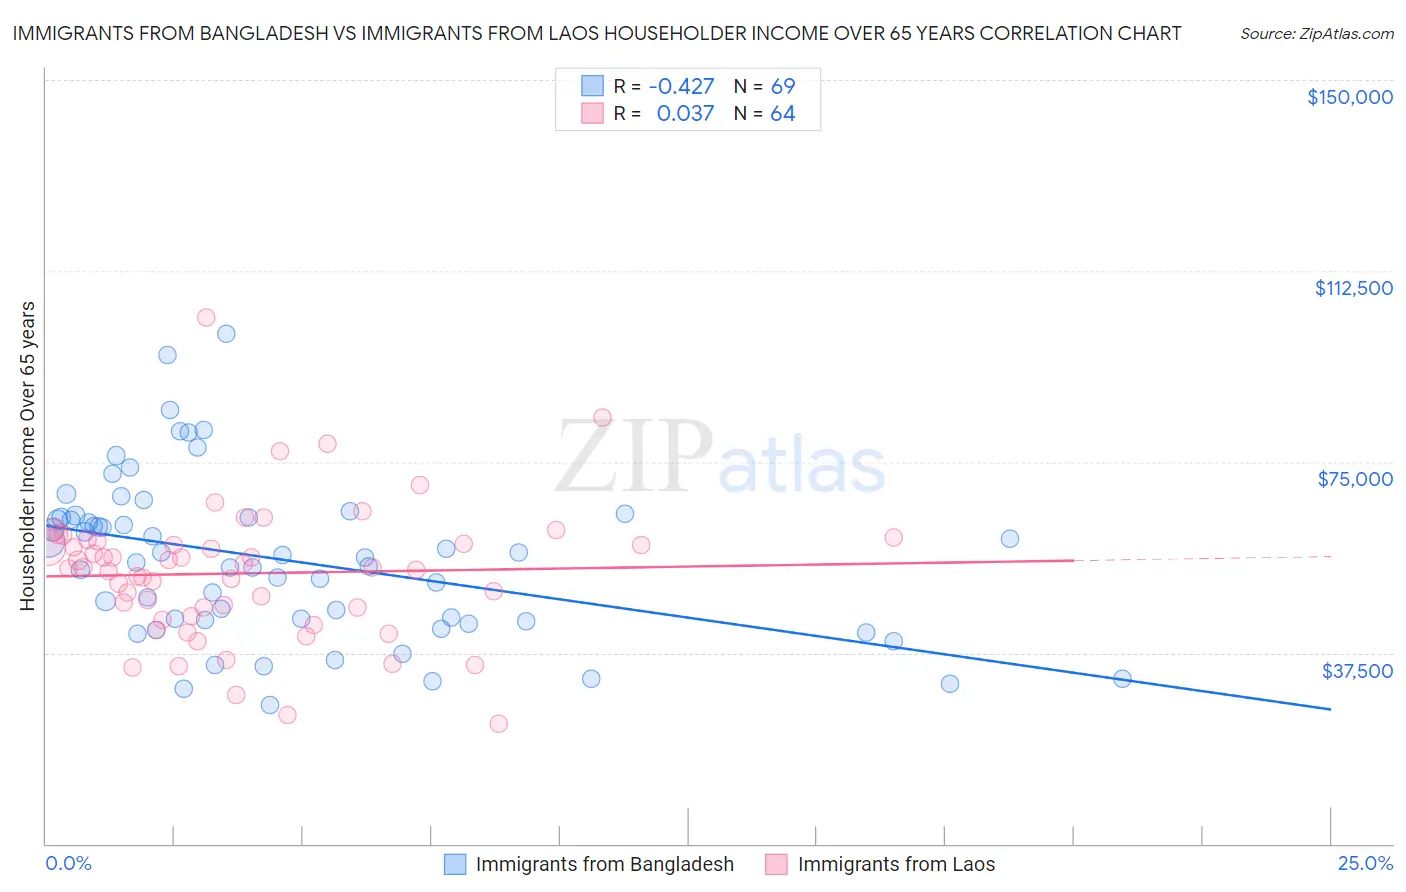
Immigrants from Bangladesh vs Immigrants from Laos Householder Income Over 65 years Correlation Chart
The statistical analysis conducted on geographies consisting of 203,315,091 people shows a moderate negative correlation between the proportion of Immigrants from Bangladesh and household income with householder over the age of 65 in the United States with a correlation coefficient (R) of -0.427 and weighted average of $55,394. Similarly, the statistical analysis conducted on geographies consisting of 201,251,653 people shows no correlation between the proportion of Immigrants from Laos and household income with householder over the age of 65 in the United States with a correlation coefficient (R) of 0.037 and weighted average of $56,722, a difference of 2.4%.
Householder Income Over 65 years Correlation Summary
| Measurement | Immigrants from Bangladesh | Immigrants from Laos |
| Minimum | $27,321 | $23,566 |
| Maximum | $100,278 | $103,242 |
| Range | $72,957 | $79,676 |
| Mean | $55,731 | $53,102 |
| Median | $56,176 | $54,158 |
| Interquartile 25% (IQ1) | $43,751 | $45,496 |
| Interquartile 75% (IQ3) | $64,071 | $59,129 |
| Interquartile Range (IQR) | $20,321 | $13,634 |
| Standard Deviation (Sample) | $15,711 | $13,383 |
| Standard Deviation (Population) | $15,596 | $13,278 |
Demographics Similar to Immigrants from Bangladesh and Immigrants from Laos by Householder Income Over 65 years
In terms of householder income over 65 years, the demographic groups most similar to Immigrants from Bangladesh are German Russian ($55,356, a difference of 0.070%), Trinidadian and Tobagonian ($55,327, a difference of 0.12%), American ($55,527, a difference of 0.24%), Immigrants from Trinidad and Tobago ($55,598, a difference of 0.37%), and Osage ($55,677, a difference of 0.51%). Similarly, the demographic groups most similar to Immigrants from Laos are Fijian ($56,768, a difference of 0.080%), Subsaharan African ($56,615, a difference of 0.19%), Immigrants from Panama ($56,944, a difference of 0.39%), Immigrants from Guyana ($56,495, a difference of 0.40%), and Yaqui ($56,417, a difference of 0.54%).
| Demographics | Rating | Rank | Householder Income Over 65 years |
| Immigrants | Panama | 1.5 /100 | #237 | Tragic $56,944 |
| Fijians | 1.2 /100 | #238 | Tragic $56,768 |
| Immigrants | Laos | 1.2 /100 | #239 | Tragic $56,722 |
| Sub-Saharan Africans | 1.0 /100 | #240 | Tragic $56,615 |
| Immigrants | Guyana | 0.9 /100 | #241 | Tragic $56,495 |
| Yaqui | 0.8 /100 | #242 | Tragic $56,417 |
| Guyanese | 0.8 /100 | #243 | Tragic $56,351 |
| Hmong | 0.8 /100 | #244 | Tragic $56,339 |
| Immigrants | Uzbekistan | 0.8 /100 | #245 | Tragic $56,331 |
| Central Americans | 0.8 /100 | #246 | Tragic $56,321 |
| Yakama | 0.7 /100 | #247 | Tragic $56,234 |
| Vietnamese | 0.6 /100 | #248 | Tragic $56,143 |
| Mexican American Indians | 0.6 /100 | #249 | Tragic $56,089 |
| Immigrants | Bosnia and Herzegovina | 0.5 /100 | #250 | Tragic $55,986 |
| Immigrants | Portugal | 0.5 /100 | #251 | Tragic $55,924 |
| Osage | 0.4 /100 | #252 | Tragic $55,677 |
| Immigrants | Trinidad and Tobago | 0.4 /100 | #253 | Tragic $55,598 |
| Americans | 0.3 /100 | #254 | Tragic $55,527 |
| Immigrants | Bangladesh | 0.3 /100 | #255 | Tragic $55,394 |
| German Russians | 0.3 /100 | #256 | Tragic $55,356 |
| Trinidadians and Tobagonians | 0.3 /100 | #257 | Tragic $55,327 |