Romanian vs Guatemalan Householder Income Ages 45 - 64 years
COMPARE
Romanian
Guatemalan
Householder Income Ages 45 - 64 years
Householder Income Ages 45 - 64 years Comparison
Romanians
Guatemalans
$108,609
HOUSEHOLDER INCOME AGES 45 - 64 YEARS
98.5/ 100
METRIC RATING
88th/ 347
METRIC RANK
$87,705
HOUSEHOLDER INCOME AGES 45 - 64 YEARS
0.2/ 100
METRIC RATING
271st/ 347
METRIC RANK
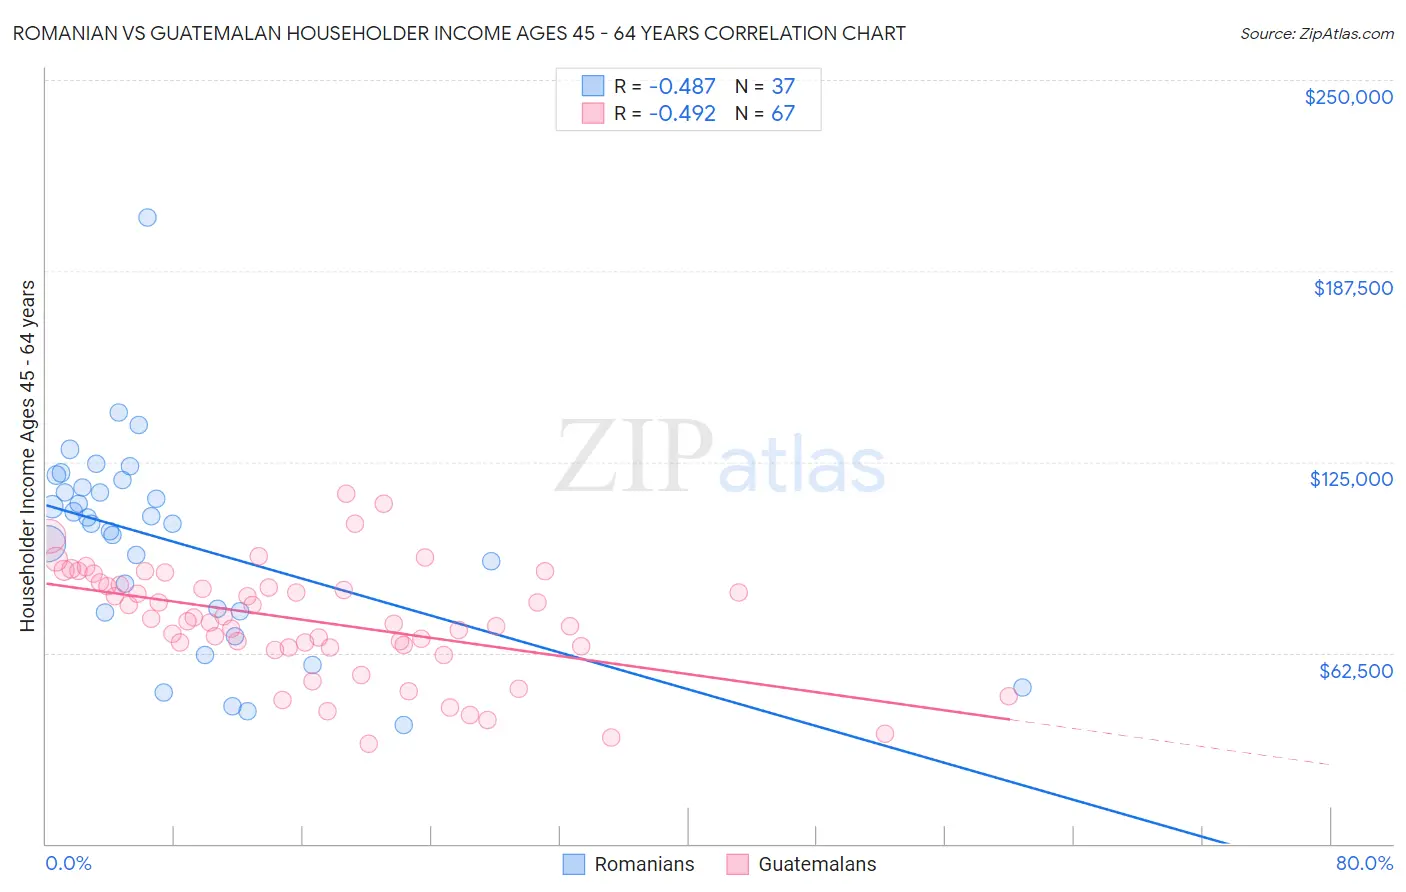
Romanian vs Guatemalan Householder Income Ages 45 - 64 years Correlation Chart
The statistical analysis conducted on geographies consisting of 377,316,038 people shows a moderate negative correlation between the proportion of Romanians and household income with householder between the ages 45 and 64 in the United States with a correlation coefficient (R) of -0.487 and weighted average of $108,609. Similarly, the statistical analysis conducted on geographies consisting of 408,736,377 people shows a moderate negative correlation between the proportion of Guatemalans and household income with householder between the ages 45 and 64 in the United States with a correlation coefficient (R) of -0.492 and weighted average of $87,705, a difference of 23.8%.
Householder Income Ages 45 - 64 years Correlation Summary
| Measurement | Romanian | Guatemalan |
| Minimum | $38,906 | $32,665 |
| Maximum | $205,179 | $114,444 |
| Range | $166,273 | $81,779 |
| Mean | $98,730 | $72,782 |
| Median | $104,735 | $72,945 |
| Interquartile 25% (IQ1) | $75,908 | $64,395 |
| Interquartile 75% (IQ3) | $117,732 | $84,870 |
| Interquartile Range (IQR) | $41,823 | $20,474 |
| Standard Deviation (Sample) | $33,257 | $18,098 |
| Standard Deviation (Population) | $32,804 | $17,962 |
Similar Demographics by Householder Income Ages 45 - 64 years
Demographics Similar to Romanians by Householder Income Ages 45 - 64 years
In terms of householder income ages 45 - 64 years, the demographic groups most similar to Romanians are Tongan ($108,643, a difference of 0.030%), Austrian ($108,692, a difference of 0.080%), Ukrainian ($108,475, a difference of 0.12%), Immigrants from Philippines ($108,471, a difference of 0.13%), and Immigrants from Lebanon ($108,471, a difference of 0.13%).
| Demographics | Rating | Rank | Householder Income Ages 45 - 64 years |
| Immigrants | Eastern Europe | 98.9 /100 | #81 | Exceptional $109,335 |
| Immigrants | North America | 98.8 /100 | #82 | Exceptional $109,198 |
| Immigrants | Spain | 98.8 /100 | #83 | Exceptional $109,051 |
| Immigrants | Western Europe | 98.6 /100 | #84 | Exceptional $108,824 |
| Immigrants | Afghanistan | 98.6 /100 | #85 | Exceptional $108,785 |
| Austrians | 98.5 /100 | #86 | Exceptional $108,692 |
| Tongans | 98.5 /100 | #87 | Exceptional $108,643 |
| Romanians | 98.5 /100 | #88 | Exceptional $108,609 |
| Ukrainians | 98.3 /100 | #89 | Exceptional $108,475 |
| Immigrants | Philippines | 98.3 /100 | #90 | Exceptional $108,471 |
| Immigrants | Lebanon | 98.3 /100 | #91 | Exceptional $108,471 |
| Croatians | 98.3 /100 | #92 | Exceptional $108,383 |
| Immigrants | Croatia | 98.2 /100 | #93 | Exceptional $108,304 |
| Sri Lankans | 98.2 /100 | #94 | Exceptional $108,270 |
| Immigrants | Hungary | 98.2 /100 | #95 | Exceptional $108,267 |
Demographics Similar to Guatemalans by Householder Income Ages 45 - 64 years
In terms of householder income ages 45 - 64 years, the demographic groups most similar to Guatemalans are Immigrants from Liberia ($87,739, a difference of 0.040%), Cape Verdean ($87,580, a difference of 0.14%), Spanish American ($87,836, a difference of 0.15%), Spanish American Indian ($87,561, a difference of 0.16%), and Immigrants from Micronesia ($87,864, a difference of 0.18%).
| Demographics | Rating | Rank | Householder Income Ages 45 - 64 years |
| Osage | 0.3 /100 | #264 | Tragic $88,390 |
| Jamaicans | 0.2 /100 | #265 | Tragic $88,327 |
| Immigrants | West Indies | 0.2 /100 | #266 | Tragic $88,164 |
| Hmong | 0.2 /100 | #267 | Tragic $88,115 |
| Immigrants | Micronesia | 0.2 /100 | #268 | Tragic $87,864 |
| Spanish Americans | 0.2 /100 | #269 | Tragic $87,836 |
| Immigrants | Liberia | 0.2 /100 | #270 | Tragic $87,739 |
| Guatemalans | 0.2 /100 | #271 | Tragic $87,705 |
| Cape Verdeans | 0.2 /100 | #272 | Tragic $87,580 |
| Spanish American Indians | 0.2 /100 | #273 | Tragic $87,561 |
| Iroquois | 0.1 /100 | #274 | Tragic $87,255 |
| Immigrants | Belize | 0.1 /100 | #275 | Tragic $87,229 |
| Immigrants | Latin America | 0.1 /100 | #276 | Tragic $87,219 |
| Cree | 0.1 /100 | #277 | Tragic $87,185 |
| Immigrants | Jamaica | 0.1 /100 | #278 | Tragic $87,035 |