Puget Sound Salish vs Liberian Householder Income Under 25 years
COMPARE
Puget Sound Salish
Liberian
Householder Income Under 25 years
Householder Income Under 25 years Comparison
Puget Sound Salish
Liberians
$55,543
HOUSEHOLDER INCOME UNDER 25 YEARS
100.0/ 100
METRIC RATING
50th/ 347
METRIC RANK
$48,917
HOUSEHOLDER INCOME UNDER 25 YEARS
0.0/ 100
METRIC RATING
288th/ 347
METRIC RANK
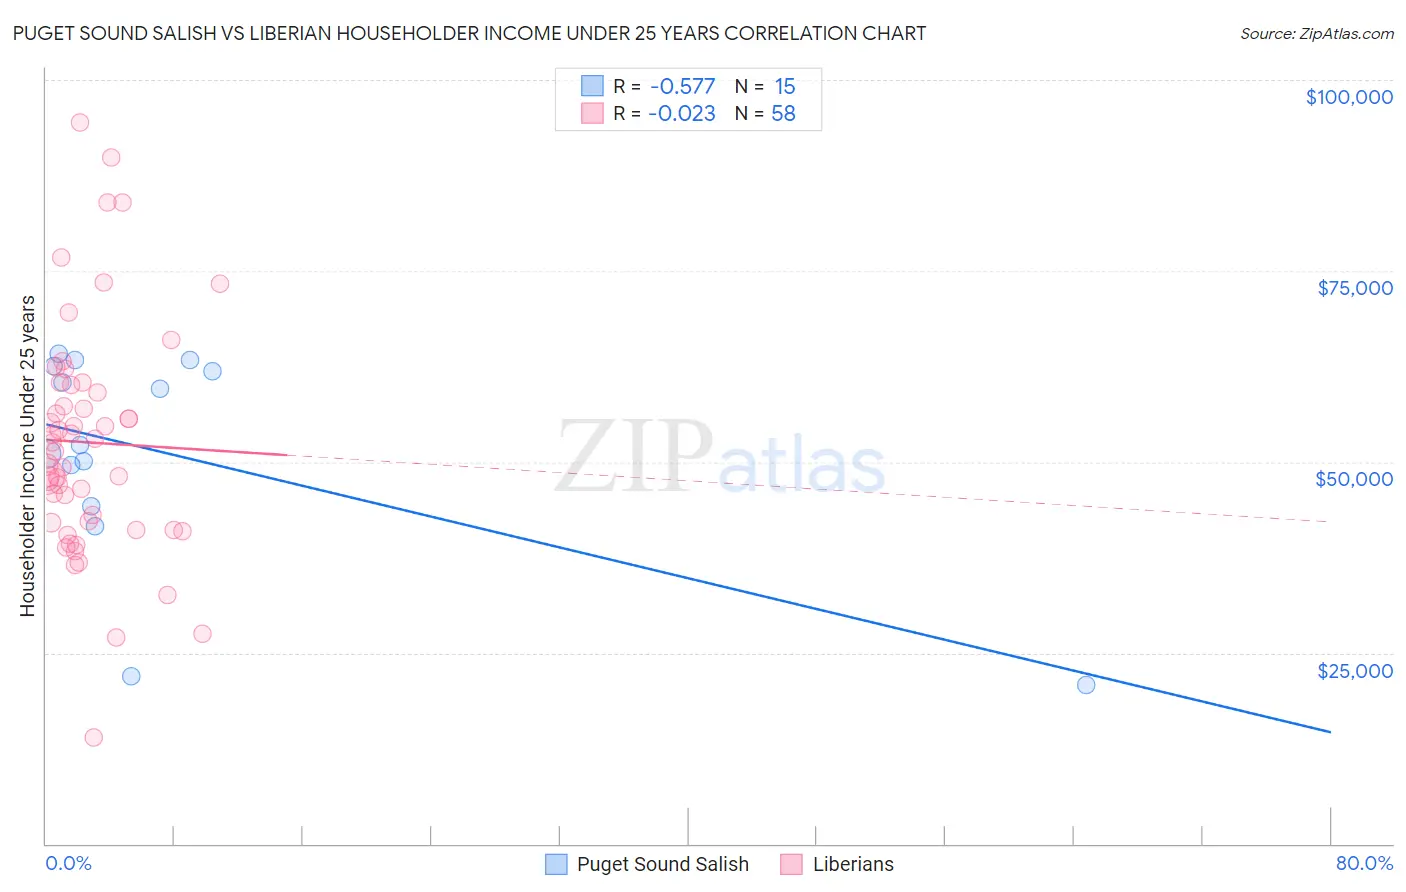
Puget Sound Salish vs Liberian Householder Income Under 25 years Correlation Chart
The statistical analysis conducted on geographies consisting of 43,619,014 people shows a substantial negative correlation between the proportion of Puget Sound Salish and household income with householder under the age of 25 in the United States with a correlation coefficient (R) of -0.577 and weighted average of $55,543. Similarly, the statistical analysis conducted on geographies consisting of 110,653,679 people shows no correlation between the proportion of Liberians and household income with householder under the age of 25 in the United States with a correlation coefficient (R) of -0.023 and weighted average of $48,917, a difference of 13.6%.
Householder Income Under 25 years Correlation Summary
| Measurement | Puget Sound Salish | Liberian |
| Minimum | $20,833 | $13,942 |
| Maximum | $64,208 | $94,479 |
| Range | $43,375 | $80,537 |
| Mean | $51,133 | $52,552 |
| Median | $52,249 | $51,943 |
| Interquartile 25% (IQ1) | $44,250 | $42,067 |
| Interquartile 75% (IQ3) | $62,601 | $60,104 |
| Interquartile Range (IQR) | $18,351 | $18,037 |
| Standard Deviation (Sample) | $14,105 | $15,238 |
| Standard Deviation (Population) | $13,627 | $15,106 |
Similar Demographics by Householder Income Under 25 years
Demographics Similar to Puget Sound Salish by Householder Income Under 25 years
In terms of householder income under 25 years, the demographic groups most similar to Puget Sound Salish are Iranian ($55,548, a difference of 0.010%), Immigrants from Vietnam ($55,562, a difference of 0.030%), Immigrants from Romania ($55,522, a difference of 0.040%), Immigrants from Indonesia ($55,521, a difference of 0.040%), and Spanish American Indian ($55,573, a difference of 0.050%).
| Demographics | Rating | Rank | Householder Income Under 25 years |
| Immigrants | South Eastern Asia | 100.0 /100 | #43 | Exceptional $55,714 |
| Paraguayans | 100.0 /100 | #44 | Exceptional $55,614 |
| Spanish American Indians | 100.0 /100 | #45 | Exceptional $55,573 |
| Immigrants | Eastern Europe | 100.0 /100 | #46 | Exceptional $55,572 |
| Cambodians | 100.0 /100 | #47 | Exceptional $55,571 |
| Immigrants | Vietnam | 100.0 /100 | #48 | Exceptional $55,562 |
| Iranians | 100.0 /100 | #49 | Exceptional $55,548 |
| Puget Sound Salish | 100.0 /100 | #50 | Exceptional $55,543 |
| Immigrants | Romania | 100.0 /100 | #51 | Exceptional $55,522 |
| Immigrants | Indonesia | 100.0 /100 | #52 | Exceptional $55,521 |
| Immigrants | Poland | 100.0 /100 | #53 | Exceptional $55,474 |
| Sri Lankans | 100.0 /100 | #54 | Exceptional $55,470 |
| Immigrants | Ukraine | 100.0 /100 | #55 | Exceptional $55,447 |
| Salvadorans | 100.0 /100 | #56 | Exceptional $55,412 |
| Soviet Union | 100.0 /100 | #57 | Exceptional $55,340 |
Demographics Similar to Liberians by Householder Income Under 25 years
In terms of householder income under 25 years, the demographic groups most similar to Liberians are Honduran ($48,885, a difference of 0.060%), Senegalese ($48,953, a difference of 0.070%), French American Indian ($48,977, a difference of 0.12%), American ($48,860, a difference of 0.12%), and Scotch-Irish ($49,039, a difference of 0.25%).
| Demographics | Rating | Rank | Householder Income Under 25 years |
| Immigrants | Nonimmigrants | 0.1 /100 | #281 | Tragic $49,348 |
| Alsatians | 0.1 /100 | #282 | Tragic $49,267 |
| Immigrants | Nigeria | 0.1 /100 | #283 | Tragic $49,174 |
| Carpatho Rusyns | 0.1 /100 | #284 | Tragic $49,113 |
| Scotch-Irish | 0.0 /100 | #285 | Tragic $49,039 |
| French American Indians | 0.0 /100 | #286 | Tragic $48,977 |
| Senegalese | 0.0 /100 | #287 | Tragic $48,953 |
| Liberians | 0.0 /100 | #288 | Tragic $48,917 |
| Hondurans | 0.0 /100 | #289 | Tragic $48,885 |
| Americans | 0.0 /100 | #290 | Tragic $48,860 |
| Immigrants | Burma/Myanmar | 0.0 /100 | #291 | Tragic $48,749 |
| Shoshone | 0.0 /100 | #292 | Tragic $48,720 |
| Sub-Saharan Africans | 0.0 /100 | #293 | Tragic $48,691 |
| Somalis | 0.0 /100 | #294 | Tragic $48,657 |
| Central American Indians | 0.0 /100 | #295 | Tragic $48,643 |