Puget Sound Salish vs Immigrants from Poland Householder Income Over 65 years
COMPARE
Puget Sound Salish
Immigrants from Poland
Householder Income Over 65 years
Householder Income Over 65 years Comparison
Puget Sound Salish
Immigrants from Poland
$59,934
HOUSEHOLDER INCOME OVER 65 YEARS
25.3/ 100
METRIC RATING
190th/ 347
METRIC RANK
$61,041
HOUSEHOLDER INCOME OVER 65 YEARS
51.9/ 100
METRIC RATING
172nd/ 347
METRIC RANK
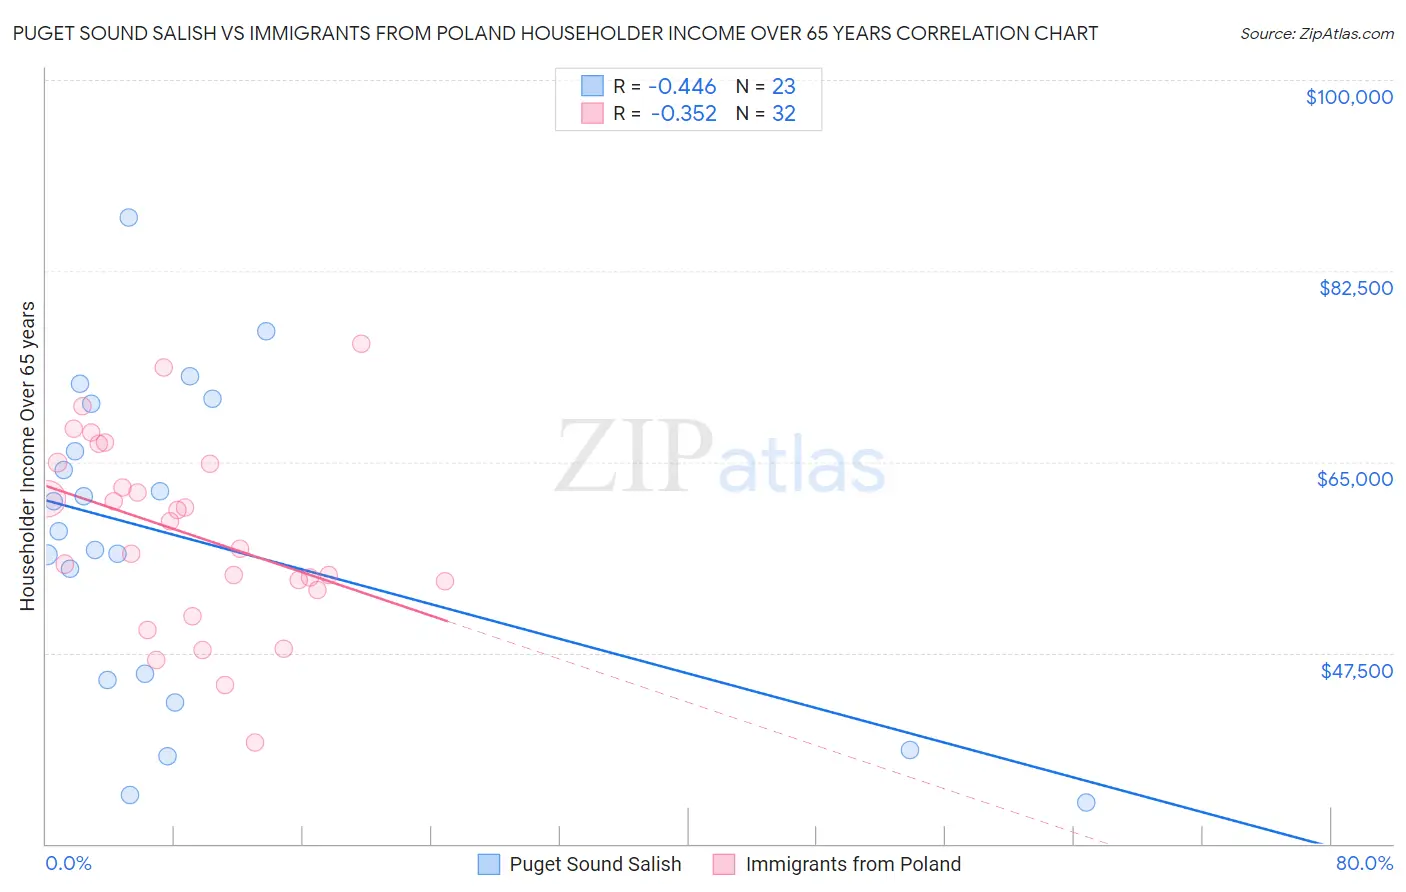
Puget Sound Salish vs Immigrants from Poland Householder Income Over 65 years Correlation Chart
The statistical analysis conducted on geographies consisting of 46,053,269 people shows a moderate negative correlation between the proportion of Puget Sound Salish and household income with householder over the age of 65 in the United States with a correlation coefficient (R) of -0.446 and weighted average of $59,934. Similarly, the statistical analysis conducted on geographies consisting of 304,365,401 people shows a mild negative correlation between the proportion of Immigrants from Poland and household income with householder over the age of 65 in the United States with a correlation coefficient (R) of -0.352 and weighted average of $61,041, a difference of 1.8%.
Householder Income Over 65 years Correlation Summary
| Measurement | Puget Sound Salish | Immigrants from Poland |
| Minimum | $33,750 | $39,327 |
| Maximum | $87,353 | $75,833 |
| Range | $53,603 | $36,506 |
| Mean | $57,757 | $58,395 |
| Median | $58,633 | $58,314 |
| Interquartile 25% (IQ1) | $44,987 | $53,627 |
| Interquartile 75% (IQ3) | $70,359 | $64,869 |
| Interquartile Range (IQR) | $25,372 | $11,242 |
| Standard Deviation (Sample) | $14,442 | $8,628 |
| Standard Deviation (Population) | $14,125 | $8,492 |
Demographics Similar to Puget Sound Salish and Immigrants from Poland by Householder Income Over 65 years
In terms of householder income over 65 years, the demographic groups most similar to Puget Sound Salish are Belgian ($59,915, a difference of 0.030%), Ghanaian ($60,043, a difference of 0.18%), Immigrants from Eritrea ($60,096, a difference of 0.27%), Immigrants from Thailand ($60,217, a difference of 0.47%), and Slovene ($60,241, a difference of 0.51%). Similarly, the demographic groups most similar to Immigrants from Poland are Inupiat ($61,061, a difference of 0.030%), Immigrants from Micronesia ($61,000, a difference of 0.070%), Luxembourger ($60,967, a difference of 0.12%), Spaniard ($60,866, a difference of 0.29%), and Spanish ($60,795, a difference of 0.41%).
| Demographics | Rating | Rank | Householder Income Over 65 years |
| Inupiat | 52.4 /100 | #171 | Average $61,061 |
| Immigrants | Poland | 51.9 /100 | #172 | Average $61,041 |
| Immigrants | Micronesia | 50.8 /100 | #173 | Average $61,000 |
| Luxembourgers | 50.0 /100 | #174 | Average $60,967 |
| Spaniards | 47.3 /100 | #175 | Average $60,866 |
| Spanish | 45.5 /100 | #176 | Average $60,795 |
| Alaska Natives | 44.3 /100 | #177 | Average $60,748 |
| Yup'ik | 43.7 /100 | #178 | Average $60,727 |
| Welsh | 42.2 /100 | #179 | Average $60,666 |
| Immigrants | Morocco | 41.7 /100 | #180 | Average $60,647 |
| Celtics | 40.7 /100 | #181 | Average $60,608 |
| Czechoslovakians | 40.0 /100 | #182 | Average $60,581 |
| Kenyans | 38.4 /100 | #183 | Fair $60,514 |
| Iraqis | 37.2 /100 | #184 | Fair $60,466 |
| Albanians | 32.0 /100 | #185 | Fair $60,249 |
| Slovenes | 31.8 /100 | #186 | Fair $60,241 |
| Immigrants | Thailand | 31.3 /100 | #187 | Fair $60,217 |
| Immigrants | Eritrea | 28.6 /100 | #188 | Fair $60,096 |
| Ghanaians | 27.5 /100 | #189 | Fair $60,043 |
| Puget Sound Salish | 25.3 /100 | #190 | Fair $59,934 |
| Belgians | 24.9 /100 | #191 | Fair $59,915 |