Puget Sound Salish vs Cape Verdean Householder Income Over 65 years
COMPARE
Puget Sound Salish
Cape Verdean
Householder Income Over 65 years
Householder Income Over 65 years Comparison
Puget Sound Salish
Cape Verdeans
$59,934
HOUSEHOLDER INCOME OVER 65 YEARS
25.3/ 100
METRIC RATING
190th/ 347
METRIC RANK
$50,077
HOUSEHOLDER INCOME OVER 65 YEARS
0.0/ 100
METRIC RATING
333rd/ 347
METRIC RANK
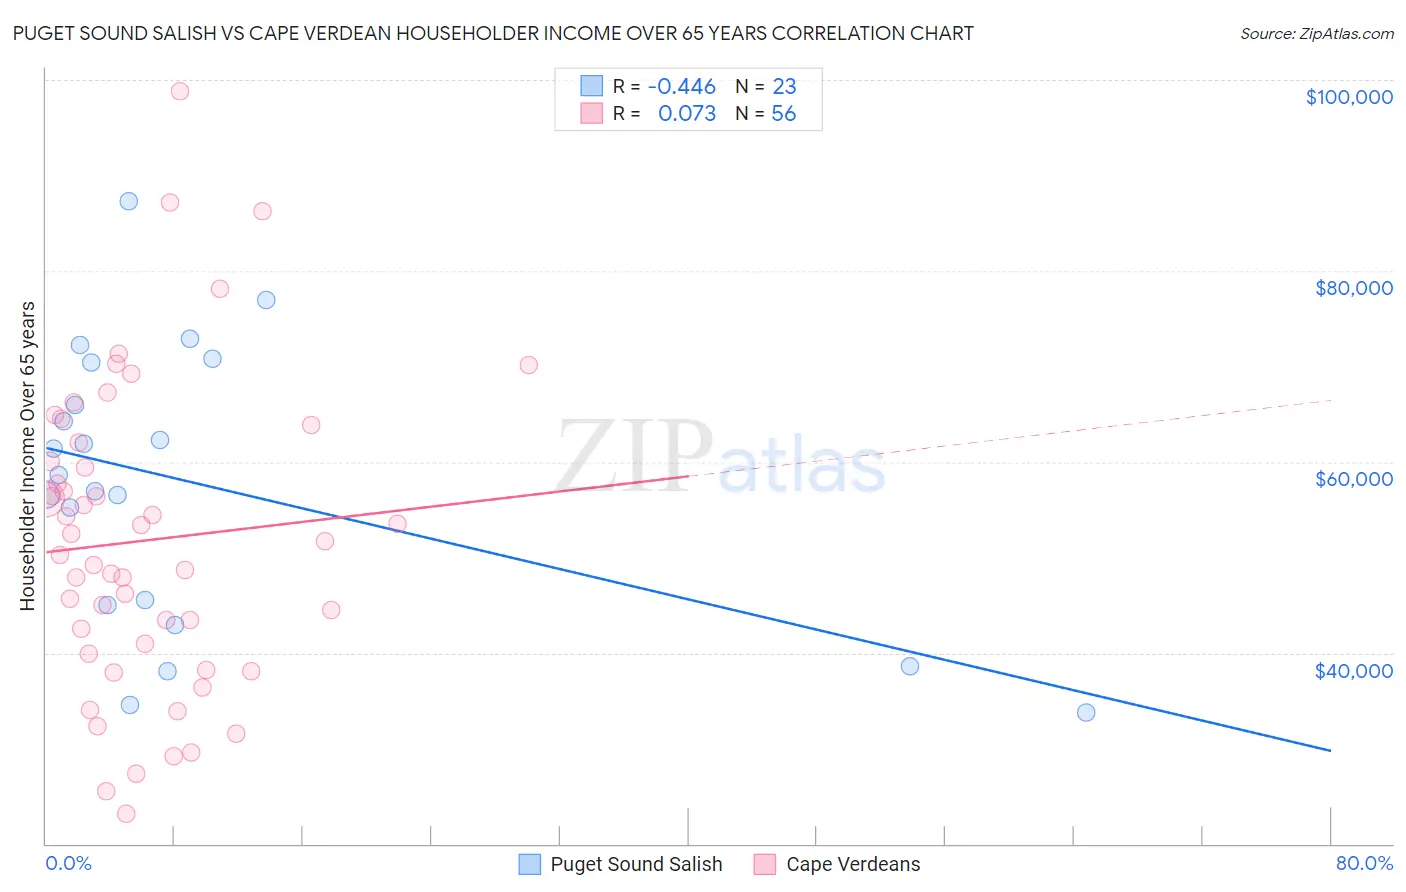
Puget Sound Salish vs Cape Verdean Householder Income Over 65 years Correlation Chart
The statistical analysis conducted on geographies consisting of 46,053,269 people shows a moderate negative correlation between the proportion of Puget Sound Salish and household income with householder over the age of 65 in the United States with a correlation coefficient (R) of -0.446 and weighted average of $59,934. Similarly, the statistical analysis conducted on geographies consisting of 107,432,324 people shows a slight positive correlation between the proportion of Cape Verdeans and household income with householder over the age of 65 in the United States with a correlation coefficient (R) of 0.073 and weighted average of $50,077, a difference of 19.7%.
Householder Income Over 65 years Correlation Summary
| Measurement | Puget Sound Salish | Cape Verdean |
| Minimum | $33,750 | $23,194 |
| Maximum | $87,353 | $98,819 |
| Range | $53,603 | $75,625 |
| Mean | $57,757 | $51,774 |
| Median | $58,633 | $50,968 |
| Interquartile 25% (IQ1) | $44,987 | $40,388 |
| Interquartile 75% (IQ3) | $70,359 | $61,045 |
| Interquartile Range (IQR) | $25,372 | $20,657 |
| Standard Deviation (Sample) | $14,442 | $15,999 |
| Standard Deviation (Population) | $14,125 | $15,855 |
Similar Demographics by Householder Income Over 65 years
Demographics Similar to Puget Sound Salish by Householder Income Over 65 years
In terms of householder income over 65 years, the demographic groups most similar to Puget Sound Salish are Belgian ($59,915, a difference of 0.030%), South American ($59,854, a difference of 0.13%), Immigrants from Costa Rica ($59,848, a difference of 0.14%), Immigrants from Africa ($59,837, a difference of 0.16%), and Ghanaian ($60,043, a difference of 0.18%).
| Demographics | Rating | Rank | Householder Income Over 65 years |
| Kenyans | 38.4 /100 | #183 | Fair $60,514 |
| Iraqis | 37.2 /100 | #184 | Fair $60,466 |
| Albanians | 32.0 /100 | #185 | Fair $60,249 |
| Slovenes | 31.8 /100 | #186 | Fair $60,241 |
| Immigrants | Thailand | 31.3 /100 | #187 | Fair $60,217 |
| Immigrants | Eritrea | 28.6 /100 | #188 | Fair $60,096 |
| Ghanaians | 27.5 /100 | #189 | Fair $60,043 |
| Puget Sound Salish | 25.3 /100 | #190 | Fair $59,934 |
| Belgians | 24.9 /100 | #191 | Fair $59,915 |
| South Americans | 23.8 /100 | #192 | Fair $59,854 |
| Immigrants | Costa Rica | 23.6 /100 | #193 | Fair $59,848 |
| Immigrants | Africa | 23.4 /100 | #194 | Fair $59,837 |
| Immigrants | Iraq | 23.2 /100 | #195 | Fair $59,824 |
| Germans | 21.5 /100 | #196 | Fair $59,730 |
| Immigrants | Kenya | 21.1 /100 | #197 | Fair $59,710 |
Demographics Similar to Cape Verdeans by Householder Income Over 65 years
In terms of householder income over 65 years, the demographic groups most similar to Cape Verdeans are Immigrants from Dominica ($50,071, a difference of 0.010%), Dutch West Indian ($50,475, a difference of 0.79%), Pima ($50,539, a difference of 0.92%), Immigrants from Grenada ($50,747, a difference of 1.3%), and Black/African American ($50,779, a difference of 1.4%).
| Demographics | Rating | Rank | Householder Income Over 65 years |
| Kiowa | 0.0 /100 | #326 | Tragic $51,140 |
| Bahamians | 0.0 /100 | #327 | Tragic $51,000 |
| Hopi | 0.0 /100 | #328 | Tragic $50,925 |
| Blacks/African Americans | 0.0 /100 | #329 | Tragic $50,779 |
| Immigrants | Grenada | 0.0 /100 | #330 | Tragic $50,747 |
| Pima | 0.0 /100 | #331 | Tragic $50,539 |
| Dutch West Indians | 0.0 /100 | #332 | Tragic $50,475 |
| Cape Verdeans | 0.0 /100 | #333 | Tragic $50,077 |
| Immigrants | Dominica | 0.0 /100 | #334 | Tragic $50,071 |
| Crow | 0.0 /100 | #335 | Tragic $49,234 |
| Cubans | 0.0 /100 | #336 | Tragic $49,152 |
| Tohono O'odham | 0.0 /100 | #337 | Tragic $49,121 |
| Immigrants | Caribbean | 0.0 /100 | #338 | Tragic $48,535 |
| Navajo | 0.0 /100 | #339 | Tragic $47,722 |
| Immigrants | Yemen | 0.0 /100 | #340 | Tragic $47,527 |