Puget Sound Salish vs Mexican American Indian 5th Grade
COMPARE
Puget Sound Salish
Mexican American Indian
5th Grade
5th Grade Comparison
Puget Sound Salish
Mexican American Indians
97.7%
5TH GRADE
98.3/ 100
METRIC RATING
100th/ 347
METRIC RANK
95.5%
5TH GRADE
0.0/ 100
METRIC RATING
329th/ 347
METRIC RANK
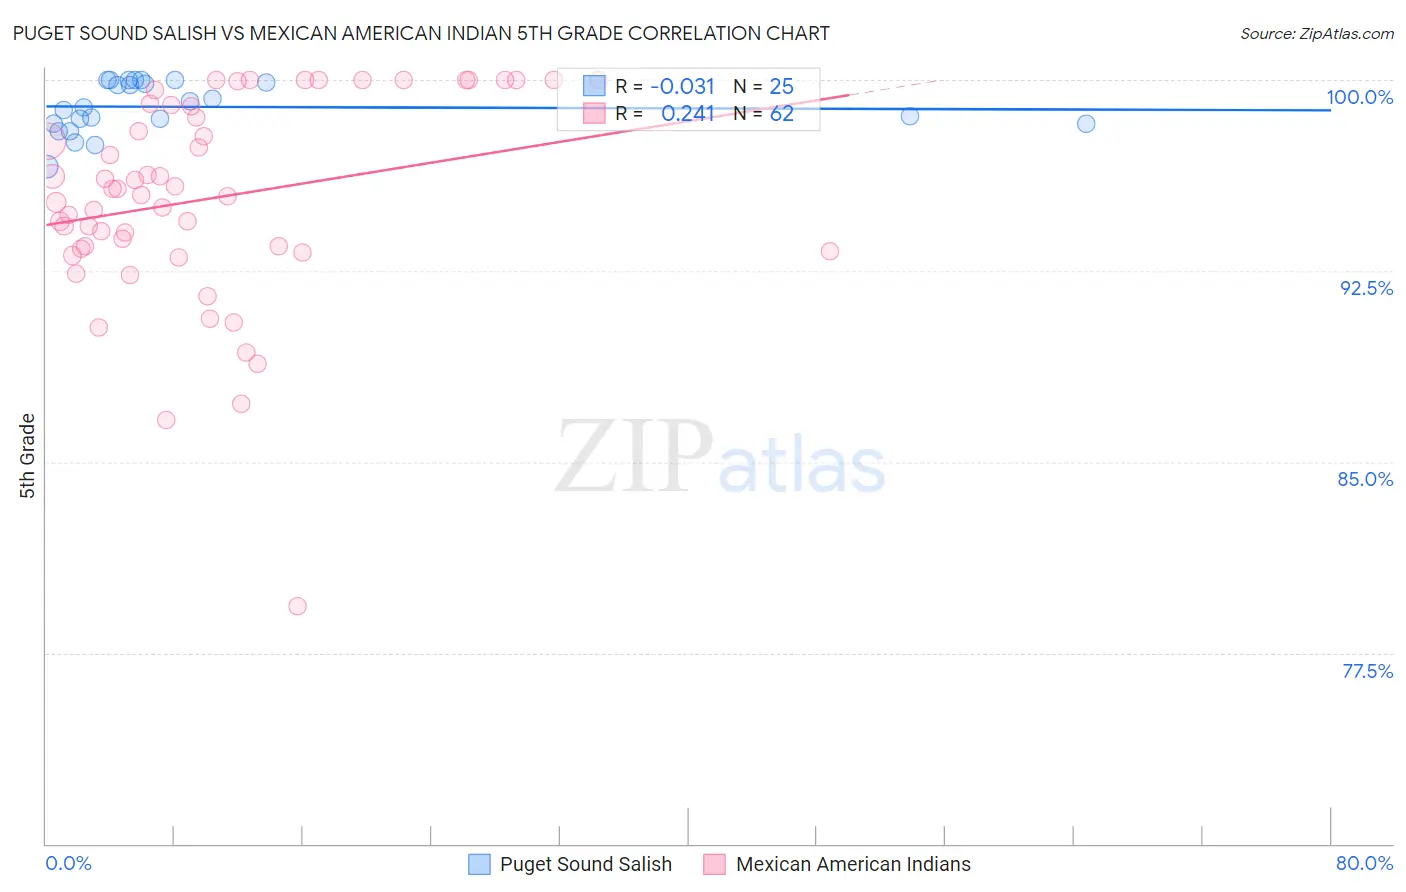
Puget Sound Salish vs Mexican American Indian 5th Grade Correlation Chart
The statistical analysis conducted on geographies consisting of 46,155,746 people shows no correlation between the proportion of Puget Sound Salish and percentage of population with at least 5th grade education in the United States with a correlation coefficient (R) of -0.031 and weighted average of 97.7%. Similarly, the statistical analysis conducted on geographies consisting of 317,621,104 people shows a weak positive correlation between the proportion of Mexican American Indians and percentage of population with at least 5th grade education in the United States with a correlation coefficient (R) of 0.241 and weighted average of 95.5%, a difference of 2.3%.
5th Grade Correlation Summary
| Measurement | Puget Sound Salish | Mexican American Indian |
| Minimum | 96.6% | 79.3% |
| Maximum | 100.0% | 100.0% |
| Range | 3.4% | 20.7% |
| Mean | 98.9% | 95.4% |
| Median | 98.9% | 95.6% |
| Interquartile 25% (IQ1) | 98.3% | 93.4% |
| Interquartile 75% (IQ3) | 100.0% | 99.0% |
| Interquartile Range (IQR) | 1.7% | 5.6% |
| Standard Deviation (Sample) | 0.99% | 4.1% |
| Standard Deviation (Population) | 0.97% | 4.0% |
Similar Demographics by 5th Grade
Demographics Similar to Puget Sound Salish by 5th Grade
In terms of 5th grade, the demographic groups most similar to Puget Sound Salish are Yugoslavian (97.7%, a difference of 0.0%), Turkish (97.7%, a difference of 0.0%), South African (97.7%, a difference of 0.0%), Cree (97.7%, a difference of 0.010%), and Delaware (97.8%, a difference of 0.020%).
| Demographics | Rating | Rank | 5th Grade |
| Delaware | 98.6 /100 | #93 | Exceptional 97.8% |
| Immigrants | Denmark | 98.6 /100 | #94 | Exceptional 97.8% |
| Romanians | 98.6 /100 | #95 | Exceptional 97.8% |
| Immigrants | Germany | 98.5 /100 | #96 | Exceptional 97.8% |
| Cree | 98.4 /100 | #97 | Exceptional 97.7% |
| Yugoslavians | 98.3 /100 | #98 | Exceptional 97.7% |
| Turks | 98.3 /100 | #99 | Exceptional 97.7% |
| Puget Sound Salish | 98.3 /100 | #100 | Exceptional 97.7% |
| South Africans | 98.3 /100 | #101 | Exceptional 97.7% |
| Choctaw | 98.0 /100 | #102 | Exceptional 97.7% |
| Cheyenne | 97.9 /100 | #103 | Exceptional 97.7% |
| German Russians | 97.8 /100 | #104 | Exceptional 97.7% |
| Bhutanese | 97.6 /100 | #105 | Exceptional 97.7% |
| Immigrants | Czechoslovakia | 97.5 /100 | #106 | Exceptional 97.7% |
| Immigrants | Singapore | 97.5 /100 | #107 | Exceptional 97.7% |
Demographics Similar to Mexican American Indians by 5th Grade
In terms of 5th grade, the demographic groups most similar to Mexican American Indians are Cape Verdean (95.5%, a difference of 0.010%), Immigrants from Cambodia (95.5%, a difference of 0.040%), Dominican (95.5%, a difference of 0.040%), Honduran (95.6%, a difference of 0.070%), and Hispanic or Latino (95.6%, a difference of 0.070%).
| Demographics | Rating | Rank | 5th Grade |
| Immigrants | Nicaragua | 0.0 /100 | #322 | Tragic 95.6% |
| Immigrants | Fiji | 0.0 /100 | #323 | Tragic 95.6% |
| Hondurans | 0.0 /100 | #324 | Tragic 95.6% |
| Hispanics or Latinos | 0.0 /100 | #325 | Tragic 95.6% |
| Immigrants | Cambodia | 0.0 /100 | #326 | Tragic 95.5% |
| Dominicans | 0.0 /100 | #327 | Tragic 95.5% |
| Cape Verdeans | 0.0 /100 | #328 | Tragic 95.5% |
| Mexican American Indians | 0.0 /100 | #329 | Tragic 95.5% |
| Immigrants | Armenia | 0.0 /100 | #330 | Tragic 95.4% |
| Immigrants | Honduras | 0.0 /100 | #331 | Tragic 95.4% |
| Immigrants | Dominican Republic | 0.0 /100 | #332 | Tragic 95.3% |
| Immigrants | Latin America | 0.0 /100 | #333 | Tragic 95.3% |
| Nepalese | 0.0 /100 | #334 | Tragic 95.2% |
| Mexicans | 0.0 /100 | #335 | Tragic 95.2% |
| Immigrants | Azores | 0.0 /100 | #336 | Tragic 95.1% |