Puget Sound Salish vs Mexican American Indian Unemployment Among Ages 25 to 29 years
COMPARE
Puget Sound Salish
Mexican American Indian
Unemployment Among Ages 25 to 29 years
Unemployment Among Ages 25 to 29 years Comparison
Puget Sound Salish
Mexican American Indians
7.1%
UNEMPLOYMENT AMONG AGES 25 TO 29 YEARS
1.8/ 100
METRIC RATING
237th/ 347
METRIC RANK
7.3%
UNEMPLOYMENT AMONG AGES 25 TO 29 YEARS
0.3/ 100
METRIC RATING
256th/ 347
METRIC RANK
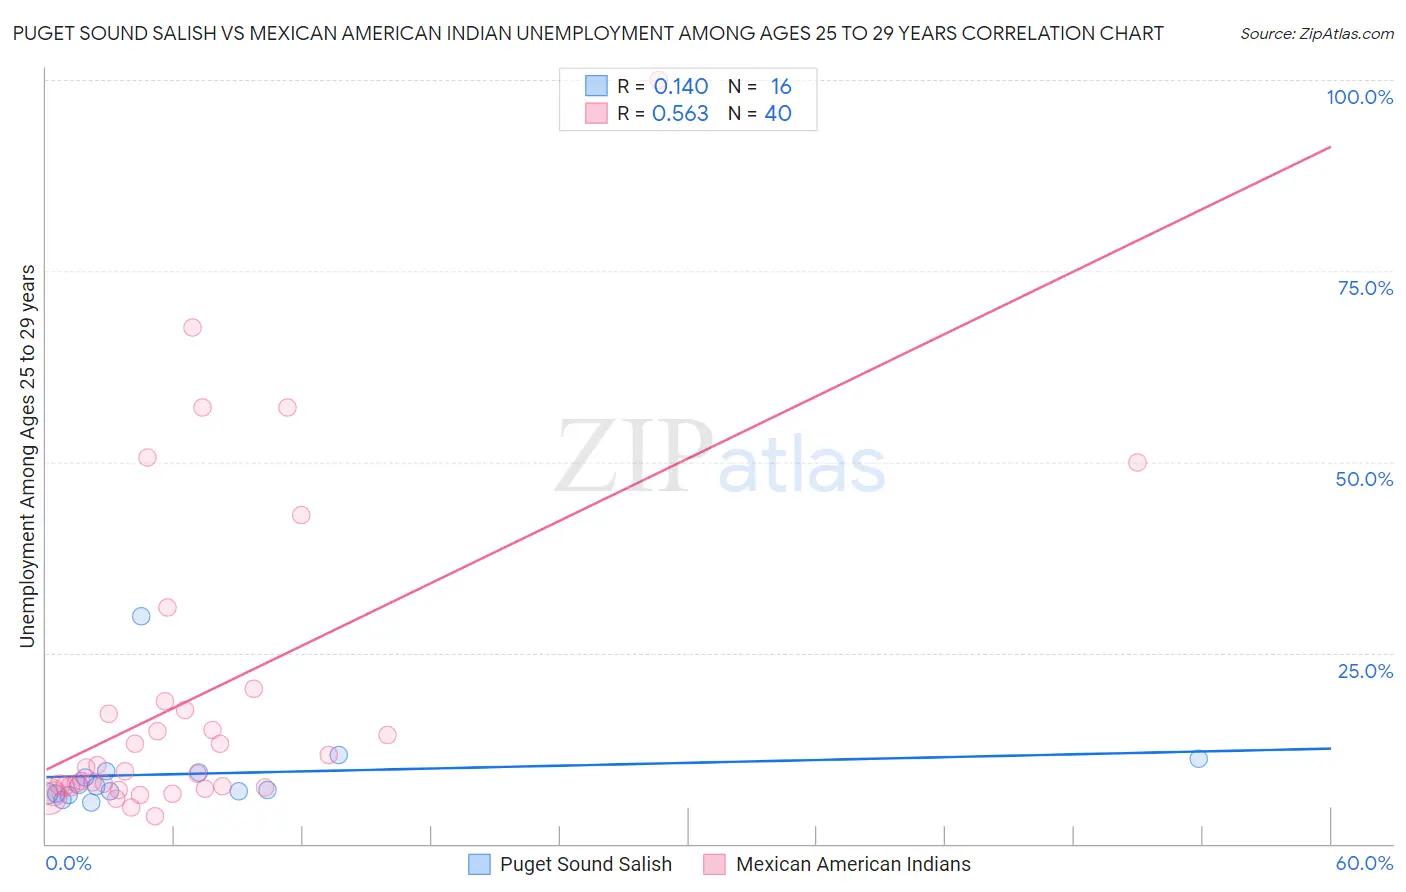
Puget Sound Salish vs Mexican American Indian Unemployment Among Ages 25 to 29 years Correlation Chart
The statistical analysis conducted on geographies consisting of 45,327,294 people shows a poor positive correlation between the proportion of Puget Sound Salish and unemployment rate among population between the ages 25 and 29 in the United States with a correlation coefficient (R) of 0.140 and weighted average of 7.1%. Similarly, the statistical analysis conducted on geographies consisting of 308,255,132 people shows a substantial positive correlation between the proportion of Mexican American Indians and unemployment rate among population between the ages 25 and 29 in the United States with a correlation coefficient (R) of 0.563 and weighted average of 7.3%, a difference of 2.9%.
Unemployment Among Ages 25 to 29 years Correlation Summary
| Measurement | Puget Sound Salish | Mexican American Indian |
| Minimum | 5.4% | 3.6% |
| Maximum | 29.7% | 100.0% |
| Range | 24.4% | 96.4% |
| Mean | 9.2% | 19.4% |
| Median | 7.3% | 9.7% |
| Interquartile 25% (IQ1) | 6.6% | 7.4% |
| Interquartile 75% (IQ3) | 9.4% | 18.1% |
| Interquartile Range (IQR) | 2.8% | 10.6% |
| Standard Deviation (Sample) | 5.8% | 21.3% |
| Standard Deviation (Population) | 5.6% | 21.0% |
Demographics Similar to Puget Sound Salish and Mexican American Indians by Unemployment Among Ages 25 to 29 years
In terms of unemployment among ages 25 to 29 years, the demographic groups most similar to Puget Sound Salish are Honduran (7.1%, a difference of 0.020%), Cape Verdean (7.0%, a difference of 0.070%), Potawatomi (7.1%, a difference of 0.48%), Native Hawaiian (7.1%, a difference of 0.51%), and Immigrants from Sierra Leone (7.1%, a difference of 0.55%). Similarly, the demographic groups most similar to Mexican American Indians are Immigrants from Cameroon (7.2%, a difference of 0.20%), Ghanaian (7.2%, a difference of 0.26%), Immigrants from Portugal (7.2%, a difference of 0.40%), Sierra Leonean (7.2%, a difference of 0.73%), and Portuguese (7.2%, a difference of 0.99%).
| Demographics | Rating | Rank | Unemployment Among Ages 25 to 29 years |
| Cape Verdeans | 1.9 /100 | #236 | Tragic 7.0% |
| Puget Sound Salish | 1.8 /100 | #237 | Tragic 7.1% |
| Hondurans | 1.8 /100 | #238 | Tragic 7.1% |
| Potawatomi | 1.3 /100 | #239 | Tragic 7.1% |
| Native Hawaiians | 1.3 /100 | #240 | Tragic 7.1% |
| Immigrants | Sierra Leone | 1.3 /100 | #241 | Tragic 7.1% |
| Spanish American Indians | 1.1 /100 | #242 | Tragic 7.1% |
| Yaqui | 1.0 /100 | #243 | Tragic 7.1% |
| Immigrants | Nonimmigrants | 0.9 /100 | #244 | Tragic 7.1% |
| Guatemalans | 0.9 /100 | #245 | Tragic 7.1% |
| Immigrants | Uzbekistan | 0.7 /100 | #246 | Tragic 7.2% |
| Immigrants | Guatemala | 0.7 /100 | #247 | Tragic 7.2% |
| Sub-Saharan Africans | 0.6 /100 | #248 | Tragic 7.2% |
| Seminole | 0.6 /100 | #249 | Tragic 7.2% |
| Delaware | 0.5 /100 | #250 | Tragic 7.2% |
| Portuguese | 0.5 /100 | #251 | Tragic 7.2% |
| Sierra Leoneans | 0.4 /100 | #252 | Tragic 7.2% |
| Immigrants | Portugal | 0.3 /100 | #253 | Tragic 7.2% |
| Ghanaians | 0.3 /100 | #254 | Tragic 7.2% |
| Immigrants | Cameroon | 0.3 /100 | #255 | Tragic 7.2% |
| Mexican American Indians | 0.3 /100 | #256 | Tragic 7.3% |