Puget Sound Salish vs Apache Householder Income Ages 45 - 64 years
COMPARE
Puget Sound Salish
Apache
Householder Income Ages 45 - 64 years
Householder Income Ages 45 - 64 years Comparison
Puget Sound Salish
Apache
$98,340
HOUSEHOLDER INCOME AGES 45 - 64 YEARS
27.0/ 100
METRIC RATING
197th/ 347
METRIC RANK
$82,184
HOUSEHOLDER INCOME AGES 45 - 64 YEARS
0.0/ 100
METRIC RATING
320th/ 347
METRIC RANK
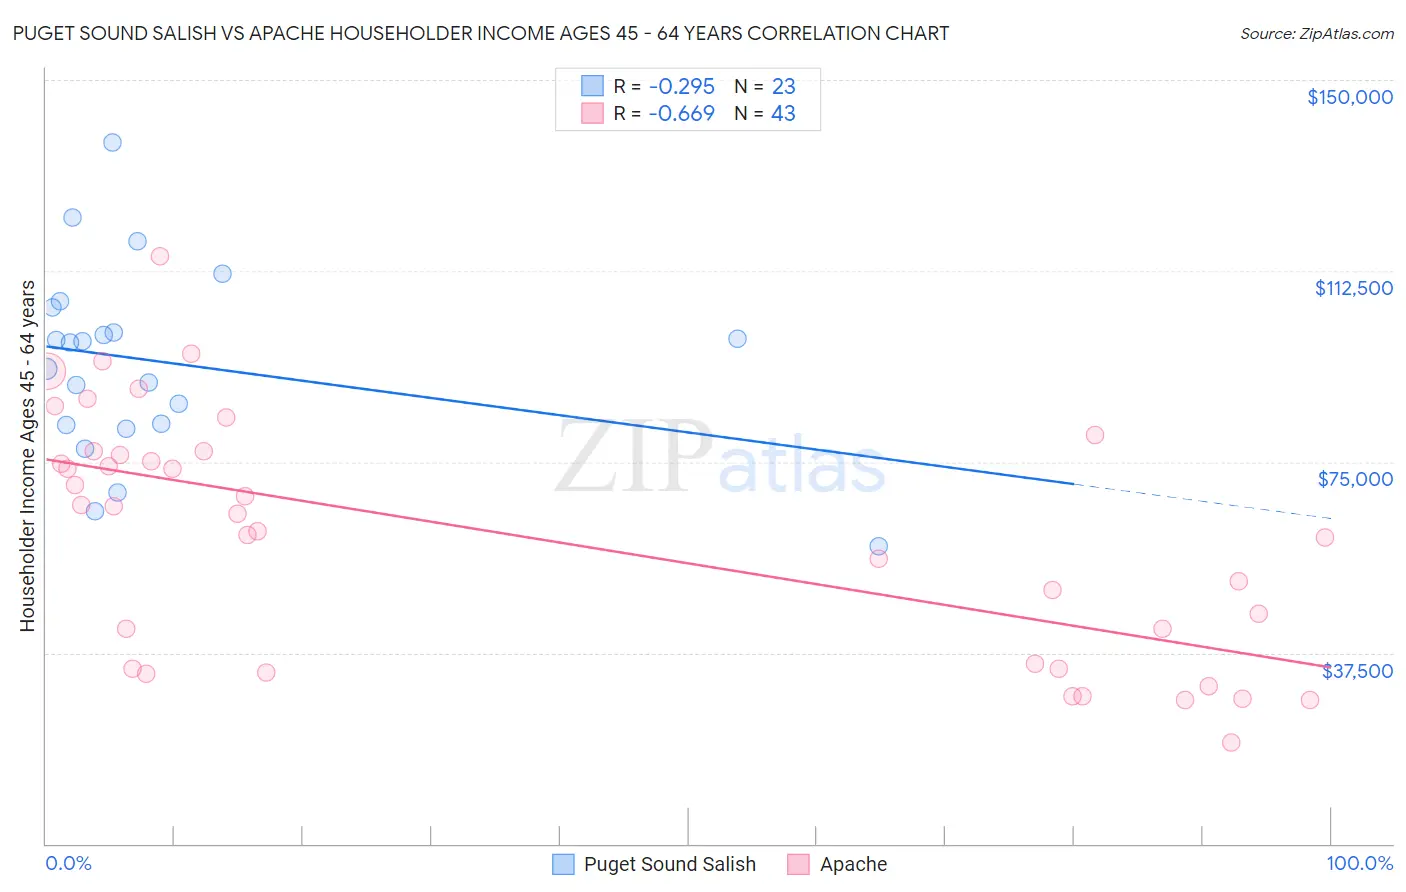
Puget Sound Salish vs Apache Householder Income Ages 45 - 64 years Correlation Chart
The statistical analysis conducted on geographies consisting of 46,126,240 people shows a weak negative correlation between the proportion of Puget Sound Salish and household income with householder between the ages 45 and 64 in the United States with a correlation coefficient (R) of -0.295 and weighted average of $98,340. Similarly, the statistical analysis conducted on geographies consisting of 230,746,916 people shows a significant negative correlation between the proportion of Apache and household income with householder between the ages 45 and 64 in the United States with a correlation coefficient (R) of -0.669 and weighted average of $82,184, a difference of 19.7%.
Householder Income Ages 45 - 64 years Correlation Summary
| Measurement | Puget Sound Salish | Apache |
| Minimum | $58,333 | $19,917 |
| Maximum | $137,604 | $115,357 |
| Range | $79,271 | $95,440 |
| Mean | $94,554 | $60,429 |
| Median | $98,357 | $64,821 |
| Interquartile 25% (IQ1) | $82,172 | $34,492 |
| Interquartile 75% (IQ3) | $105,339 | $77,043 |
| Interquartile Range (IQR) | $23,167 | $42,551 |
| Standard Deviation (Sample) | $18,602 | $23,821 |
| Standard Deviation (Population) | $18,193 | $23,542 |
Similar Demographics by Householder Income Ages 45 - 64 years
Demographics Similar to Puget Sound Salish by Householder Income Ages 45 - 64 years
In terms of householder income ages 45 - 64 years, the demographic groups most similar to Puget Sound Salish are Immigrants from Eastern Africa ($98,467, a difference of 0.13%), Immigrants from Iraq ($98,201, a difference of 0.14%), Spanish ($98,554, a difference of 0.22%), White/Caucasian ($98,091, a difference of 0.25%), and Uruguayan ($98,660, a difference of 0.32%).
| Demographics | Rating | Rank | Householder Income Ages 45 - 64 years |
| French Canadians | 35.1 /100 | #190 | Fair $99,093 |
| Kenyans | 33.7 /100 | #191 | Fair $98,970 |
| Celtics | 32.9 /100 | #192 | Fair $98,896 |
| Hawaiians | 31.6 /100 | #193 | Fair $98,778 |
| Uruguayans | 30.3 /100 | #194 | Fair $98,660 |
| Spanish | 29.2 /100 | #195 | Fair $98,554 |
| Immigrants | Eastern Africa | 28.3 /100 | #196 | Fair $98,467 |
| Puget Sound Salish | 27.0 /100 | #197 | Fair $98,340 |
| Immigrants | Iraq | 25.7 /100 | #198 | Fair $98,201 |
| Whites/Caucasians | 24.6 /100 | #199 | Fair $98,091 |
| Immigrants | Kenya | 23.5 /100 | #200 | Fair $97,964 |
| Yugoslavians | 20.0 /100 | #201 | Fair $97,558 |
| Tlingit-Haida | 18.9 /100 | #202 | Poor $97,417 |
| Immigrants | Thailand | 18.8 /100 | #203 | Poor $97,400 |
| Immigrants | Eritrea | 18.6 /100 | #204 | Poor $97,373 |
Demographics Similar to Apache by Householder Income Ages 45 - 64 years
In terms of householder income ages 45 - 64 years, the demographic groups most similar to Apache are Chickasaw ($82,193, a difference of 0.010%), Yuman ($82,139, a difference of 0.050%), Choctaw ($82,287, a difference of 0.13%), Colville ($82,474, a difference of 0.35%), and Immigrants from Caribbean ($82,513, a difference of 0.40%).
| Demographics | Rating | Rank | Householder Income Ages 45 - 64 years |
| U.S. Virgin Islanders | 0.0 /100 | #313 | Tragic $82,736 |
| Immigrants | Honduras | 0.0 /100 | #314 | Tragic $82,697 |
| Paiute | 0.0 /100 | #315 | Tragic $82,629 |
| Immigrants | Caribbean | 0.0 /100 | #316 | Tragic $82,513 |
| Colville | 0.0 /100 | #317 | Tragic $82,474 |
| Choctaw | 0.0 /100 | #318 | Tragic $82,287 |
| Chickasaw | 0.0 /100 | #319 | Tragic $82,193 |
| Apache | 0.0 /100 | #320 | Tragic $82,184 |
| Yuman | 0.0 /100 | #321 | Tragic $82,139 |
| Sioux | 0.0 /100 | #322 | Tragic $81,750 |
| Bahamians | 0.0 /100 | #323 | Tragic $81,369 |
| Yup'ik | 0.0 /100 | #324 | Tragic $81,000 |
| Immigrants | Cuba | 0.0 /100 | #325 | Tragic $80,662 |
| Dominicans | 0.0 /100 | #326 | Tragic $80,623 |
| Seminole | 0.0 /100 | #327 | Tragic $80,077 |