Immigrants from Nicaragua vs Immigrants from Lebanon Median Earnings
COMPARE
Immigrants from Nicaragua
Immigrants from Lebanon
Median Earnings
Median Earnings Comparison
Immigrants from Nicaragua
Immigrants from Lebanon
$41,737
MEDIAN EARNINGS
0.1/ 100
METRIC RATING
285th/ 347
METRIC RANK
$49,682
MEDIAN EARNINGS
99.0/ 100
METRIC RATING
96th/ 347
METRIC RANK
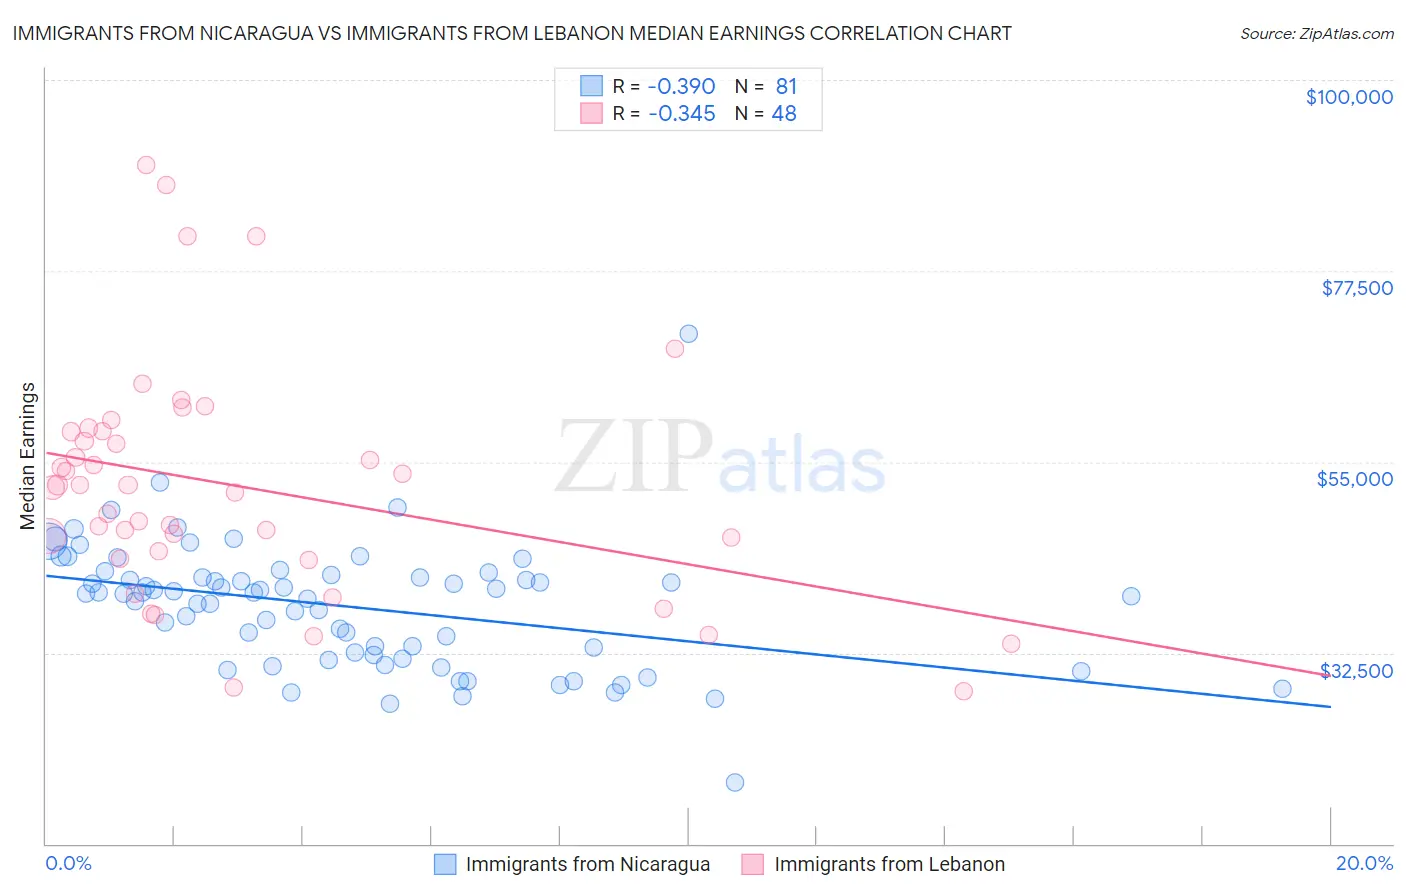
Immigrants from Nicaragua vs Immigrants from Lebanon Median Earnings Correlation Chart
The statistical analysis conducted on geographies consisting of 236,337,785 people shows a mild negative correlation between the proportion of Immigrants from Nicaragua and median earnings in the United States with a correlation coefficient (R) of -0.390 and weighted average of $41,737. Similarly, the statistical analysis conducted on geographies consisting of 217,150,005 people shows a mild negative correlation between the proportion of Immigrants from Lebanon and median earnings in the United States with a correlation coefficient (R) of -0.345 and weighted average of $49,682, a difference of 19.0%.
Median Earnings Correlation Summary
| Measurement | Immigrants from Nicaragua | Immigrants from Lebanon |
| Minimum | $17,262 | $27,932 |
| Maximum | $70,084 | $89,953 |
| Range | $52,822 | $62,021 |
| Mean | $37,945 | $52,128 |
| Median | $39,498 | $52,076 |
| Interquartile 25% (IQ1) | $31,989 | $44,033 |
| Interquartile 75% (IQ3) | $41,525 | $58,565 |
| Interquartile Range (IQR) | $9,536 | $14,532 |
| Standard Deviation (Sample) | $7,439 | $13,798 |
| Standard Deviation (Population) | $7,393 | $13,653 |
Similar Demographics by Median Earnings
Demographics Similar to Immigrants from Nicaragua by Median Earnings
In terms of median earnings, the demographic groups most similar to Immigrants from Nicaragua are Mexican American Indian ($41,719, a difference of 0.040%), Indonesian ($41,701, a difference of 0.090%), Blackfeet ($41,822, a difference of 0.20%), Dominican ($41,864, a difference of 0.31%), and Immigrants from Dominican Republic ($41,554, a difference of 0.44%).
| Demographics | Rating | Rank | Median Earnings |
| Cajuns | 0.3 /100 | #278 | Tragic $42,189 |
| Colville | 0.2 /100 | #279 | Tragic $42,151 |
| Hmong | 0.2 /100 | #280 | Tragic $42,111 |
| Marshallese | 0.2 /100 | #281 | Tragic $41,969 |
| Africans | 0.2 /100 | #282 | Tragic $41,955 |
| Dominicans | 0.2 /100 | #283 | Tragic $41,864 |
| Blackfeet | 0.2 /100 | #284 | Tragic $41,822 |
| Immigrants | Nicaragua | 0.1 /100 | #285 | Tragic $41,737 |
| Mexican American Indians | 0.1 /100 | #286 | Tragic $41,719 |
| Indonesians | 0.1 /100 | #287 | Tragic $41,701 |
| Immigrants | Dominican Republic | 0.1 /100 | #288 | Tragic $41,554 |
| Comanche | 0.1 /100 | #289 | Tragic $41,519 |
| Paiute | 0.1 /100 | #290 | Tragic $41,508 |
| Central American Indians | 0.1 /100 | #291 | Tragic $41,474 |
| U.S. Virgin Islanders | 0.1 /100 | #292 | Tragic $41,448 |
Demographics Similar to Immigrants from Lebanon by Median Earnings
In terms of median earnings, the demographic groups most similar to Immigrants from Lebanon are Immigrants from North Macedonia ($49,658, a difference of 0.050%), Immigrants from Northern Africa ($49,648, a difference of 0.070%), Immigrants from Afghanistan ($49,645, a difference of 0.070%), Immigrants from England ($49,722, a difference of 0.080%), and Croatian ($49,724, a difference of 0.090%).
| Demographics | Rating | Rank | Median Earnings |
| Immigrants | North America | 99.4 /100 | #89 | Exceptional $50,108 |
| Italians | 99.3 /100 | #90 | Exceptional $49,915 |
| Macedonians | 99.2 /100 | #91 | Exceptional $49,893 |
| Immigrants | Argentina | 99.2 /100 | #92 | Exceptional $49,841 |
| Armenians | 99.1 /100 | #93 | Exceptional $49,804 |
| Croatians | 99.0 /100 | #94 | Exceptional $49,724 |
| Immigrants | England | 99.0 /100 | #95 | Exceptional $49,722 |
| Immigrants | Lebanon | 99.0 /100 | #96 | Exceptional $49,682 |
| Immigrants | North Macedonia | 98.9 /100 | #97 | Exceptional $49,658 |
| Immigrants | Northern Africa | 98.9 /100 | #98 | Exceptional $49,648 |
| Immigrants | Afghanistan | 98.9 /100 | #99 | Exceptional $49,645 |
| Immigrants | Poland | 98.9 /100 | #100 | Exceptional $49,633 |
| Jordanians | 98.9 /100 | #101 | Exceptional $49,632 |
| Ethiopians | 98.8 /100 | #102 | Exceptional $49,572 |
| Austrians | 98.7 /100 | #103 | Exceptional $49,501 |