Puerto Rican vs Japanese Householder Income Ages 45 - 64 years
COMPARE
Puerto Rican
Japanese
Householder Income Ages 45 - 64 years
Householder Income Ages 45 - 64 years Comparison
Puerto Ricans
Japanese
$69,234
HOUSEHOLDER INCOME AGES 45 - 64 YEARS
0.0/ 100
METRIC RATING
346th/ 347
METRIC RANK
$96,834
HOUSEHOLDER INCOME AGES 45 - 64 YEARS
14.8/ 100
METRIC RATING
209th/ 347
METRIC RANK
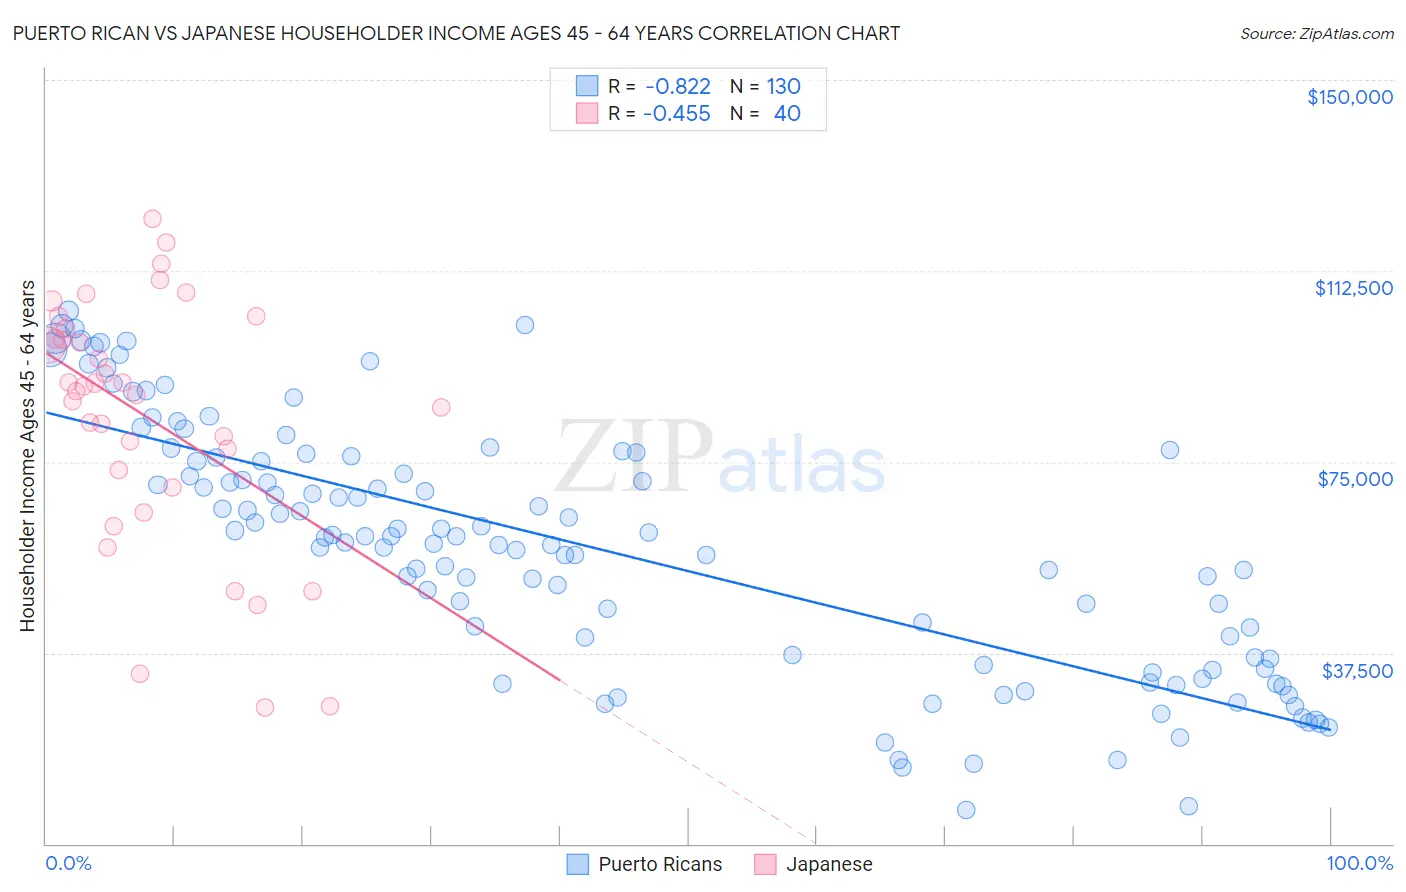
Puerto Rican vs Japanese Householder Income Ages 45 - 64 years Correlation Chart
The statistical analysis conducted on geographies consisting of 526,175,846 people shows a very strong negative correlation between the proportion of Puerto Ricans and household income with householder between the ages 45 and 64 in the United States with a correlation coefficient (R) of -0.822 and weighted average of $69,234. Similarly, the statistical analysis conducted on geographies consisting of 248,892,889 people shows a moderate negative correlation between the proportion of Japanese and household income with householder between the ages 45 and 64 in the United States with a correlation coefficient (R) of -0.455 and weighted average of $96,834, a difference of 39.9%.
Householder Income Ages 45 - 64 years Correlation Summary
| Measurement | Puerto Rican | Japanese |
| Minimum | $6,600 | $26,741 |
| Maximum | $104,645 | $122,806 |
| Range | $98,045 | $96,065 |
| Mean | $58,161 | $83,850 |
| Median | $60,296 | $89,335 |
| Interquartile 25% (IQ1) | $36,266 | $71,693 |
| Interquartile 75% (IQ3) | $75,781 | $100,167 |
| Interquartile Range (IQR) | $39,515 | $28,474 |
| Standard Deviation (Sample) | $24,341 | $24,280 |
| Standard Deviation (Population) | $24,247 | $23,975 |
Similar Demographics by Householder Income Ages 45 - 64 years
Demographics Similar to Puerto Ricans by Householder Income Ages 45 - 64 years
In terms of householder income ages 45 - 64 years, the demographic groups most similar to Puerto Ricans are Navajo ($69,759, a difference of 0.76%), Houma ($72,093, a difference of 4.1%), Pima ($73,365, a difference of 6.0%), Lumbee ($65,113, a difference of 6.3%), and Tohono O'odham ($73,774, a difference of 6.6%).
| Demographics | Rating | Rank | Householder Income Ages 45 - 64 years |
| Immigrants | Congo | 0.0 /100 | #333 | Tragic $77,850 |
| Menominee | 0.0 /100 | #334 | Tragic $76,903 |
| Cheyenne | 0.0 /100 | #335 | Tragic $76,362 |
| Arapaho | 0.0 /100 | #336 | Tragic $75,945 |
| Pueblo | 0.0 /100 | #337 | Tragic $75,601 |
| Hopi | 0.0 /100 | #338 | Tragic $75,562 |
| Kiowa | 0.0 /100 | #339 | Tragic $74,815 |
| Immigrants | Yemen | 0.0 /100 | #340 | Tragic $74,575 |
| Crow | 0.0 /100 | #341 | Tragic $74,257 |
| Tohono O'odham | 0.0 /100 | #342 | Tragic $73,774 |
| Pima | 0.0 /100 | #343 | Tragic $73,365 |
| Houma | 0.0 /100 | #344 | Tragic $72,093 |
| Navajo | 0.0 /100 | #345 | Tragic $69,759 |
| Puerto Ricans | 0.0 /100 | #346 | Tragic $69,234 |
| Lumbee | 0.0 /100 | #347 | Tragic $65,113 |
Demographics Similar to Japanese by Householder Income Ages 45 - 64 years
In terms of householder income ages 45 - 64 years, the demographic groups most similar to Japanese are Tsimshian ($96,783, a difference of 0.050%), Scotch-Irish ($97,073, a difference of 0.25%), Immigrants from Cambodia ($96,537, a difference of 0.31%), Venezuelan ($96,460, a difference of 0.39%), and Immigrants from Africa ($97,284, a difference of 0.46%).
| Demographics | Rating | Rank | Householder Income Ages 45 - 64 years |
| Tlingit-Haida | 18.9 /100 | #202 | Poor $97,417 |
| Immigrants | Thailand | 18.8 /100 | #203 | Poor $97,400 |
| Immigrants | Eritrea | 18.6 /100 | #204 | Poor $97,373 |
| Immigrants | Colombia | 18.0 /100 | #205 | Poor $97,290 |
| Immigrants | Africa | 17.9 /100 | #206 | Poor $97,284 |
| Ghanaians | 17.9 /100 | #207 | Poor $97,277 |
| Scotch-Irish | 16.4 /100 | #208 | Poor $97,073 |
| Japanese | 14.8 /100 | #209 | Poor $96,834 |
| Tsimshian | 14.5 /100 | #210 | Poor $96,783 |
| Immigrants | Cambodia | 13.0 /100 | #211 | Poor $96,537 |
| Venezuelans | 12.6 /100 | #212 | Poor $96,460 |
| Immigrants | Uruguay | 10.7 /100 | #213 | Poor $96,086 |
| Panamanians | 10.6 /100 | #214 | Poor $96,066 |
| Nigerians | 8.2 /100 | #215 | Tragic $95,492 |
| Immigrants | Venezuela | 7.6 /100 | #216 | Tragic $95,342 |