Pueblo vs Immigrants from China Median Family Income
COMPARE
Pueblo
Immigrants from China
Median Family Income
Median Family Income Comparison
Pueblo
Immigrants from China
$76,880
MEDIAN FAMILY INCOME
0.0/ 100
METRIC RATING
341st/ 347
METRIC RANK
$125,540
MEDIAN FAMILY INCOME
100.0/ 100
METRIC RATING
16th/ 347
METRIC RANK
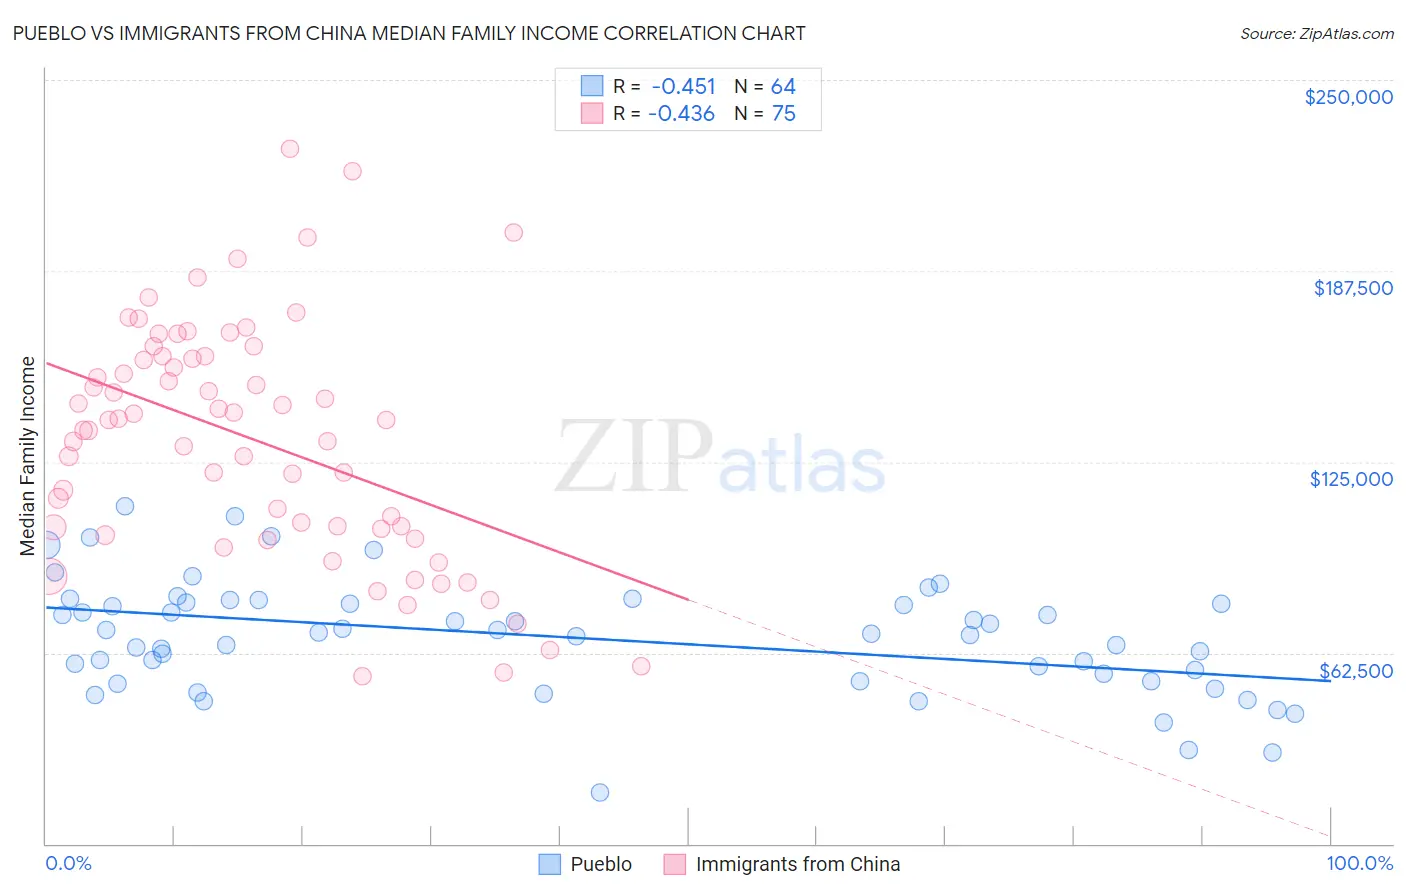
Pueblo vs Immigrants from China Median Family Income Correlation Chart
The statistical analysis conducted on geographies consisting of 120,047,767 people shows a moderate negative correlation between the proportion of Pueblo and median family income in the United States with a correlation coefficient (R) of -0.451 and weighted average of $76,880. Similarly, the statistical analysis conducted on geographies consisting of 456,354,343 people shows a moderate negative correlation between the proportion of Immigrants from China and median family income in the United States with a correlation coefficient (R) of -0.436 and weighted average of $125,540, a difference of 63.3%.
Median Family Income Correlation Summary
| Measurement | Pueblo | Immigrants from China |
| Minimum | $16,806 | $55,016 |
| Maximum | $110,375 | $227,676 |
| Range | $93,569 | $172,660 |
| Mean | $67,508 | $132,303 |
| Median | $68,832 | $138,661 |
| Interquartile 25% (IQ1) | $54,583 | $103,301 |
| Interquartile 75% (IQ3) | $78,820 | $159,432 |
| Interquartile Range (IQR) | $24,237 | $56,131 |
| Standard Deviation (Sample) | $18,534 | $38,553 |
| Standard Deviation (Population) | $18,389 | $38,295 |
Similar Demographics by Median Family Income
Demographics Similar to Pueblo by Median Family Income
In terms of median family income, the demographic groups most similar to Pueblo are Crow ($76,605, a difference of 0.36%), Hopi ($77,188, a difference of 0.40%), Pima ($77,431, a difference of 0.72%), Immigrants from Yemen ($77,457, a difference of 0.75%), and Houma ($76,188, a difference of 0.91%).
| Demographics | Rating | Rank | Median Family Income |
| Kiowa | 0.0 /100 | #333 | Tragic $80,885 |
| Menominee | 0.0 /100 | #334 | Tragic $79,563 |
| Yup'ik | 0.0 /100 | #335 | Tragic $79,290 |
| Immigrants | Cuba | 0.0 /100 | #336 | Tragic $78,249 |
| Yuman | 0.0 /100 | #337 | Tragic $78,055 |
| Immigrants | Yemen | 0.0 /100 | #338 | Tragic $77,457 |
| Pima | 0.0 /100 | #339 | Tragic $77,431 |
| Hopi | 0.0 /100 | #340 | Tragic $77,188 |
| Pueblo | 0.0 /100 | #341 | Tragic $76,880 |
| Crow | 0.0 /100 | #342 | Tragic $76,605 |
| Houma | 0.0 /100 | #343 | Tragic $76,188 |
| Tohono O'odham | 0.0 /100 | #344 | Tragic $72,193 |
| Navajo | 0.0 /100 | #345 | Tragic $70,989 |
| Puerto Ricans | 0.0 /100 | #346 | Tragic $70,423 |
| Lumbee | 0.0 /100 | #347 | Tragic $68,679 |
Demographics Similar to Immigrants from China by Median Family Income
In terms of median family income, the demographic groups most similar to Immigrants from China are Eastern European ($125,546, a difference of 0.0%), Indian (Asian) ($125,312, a difference of 0.18%), Immigrants from Eastern Asia ($125,150, a difference of 0.31%), Immigrants from South Central Asia ($125,956, a difference of 0.33%), and Immigrants from Australia ($126,620, a difference of 0.86%).
| Demographics | Rating | Rank | Median Family Income |
| Okinawans | 100.0 /100 | #9 | Exceptional $129,979 |
| Immigrants | Ireland | 100.0 /100 | #10 | Exceptional $127,584 |
| Immigrants | Israel | 100.0 /100 | #11 | Exceptional $127,430 |
| Cypriots | 100.0 /100 | #12 | Exceptional $127,064 |
| Immigrants | Australia | 100.0 /100 | #13 | Exceptional $126,620 |
| Immigrants | South Central Asia | 100.0 /100 | #14 | Exceptional $125,956 |
| Eastern Europeans | 100.0 /100 | #15 | Exceptional $125,546 |
| Immigrants | China | 100.0 /100 | #16 | Exceptional $125,540 |
| Indians (Asian) | 100.0 /100 | #17 | Exceptional $125,312 |
| Immigrants | Eastern Asia | 100.0 /100 | #18 | Exceptional $125,150 |
| Immigrants | Belgium | 100.0 /100 | #19 | Exceptional $123,831 |
| Burmese | 100.0 /100 | #20 | Exceptional $123,369 |
| Immigrants | Korea | 100.0 /100 | #21 | Exceptional $122,800 |
| Immigrants | Sweden | 100.0 /100 | #22 | Exceptional $122,765 |
| Immigrants | Japan | 100.0 /100 | #23 | Exceptional $122,764 |