Pueblo vs Immigrants from Bahamas Median Household Income
COMPARE
Pueblo
Immigrants from Bahamas
Median Household Income
Median Household Income Comparison
Pueblo
Immigrants from Bahamas
$64,692
MEDIAN HOUSEHOLD INCOME
0.0/ 100
METRIC RATING
340th/ 347
METRIC RANK
$71,349
MEDIAN HOUSEHOLD INCOME
0.0/ 100
METRIC RATING
313th/ 347
METRIC RANK
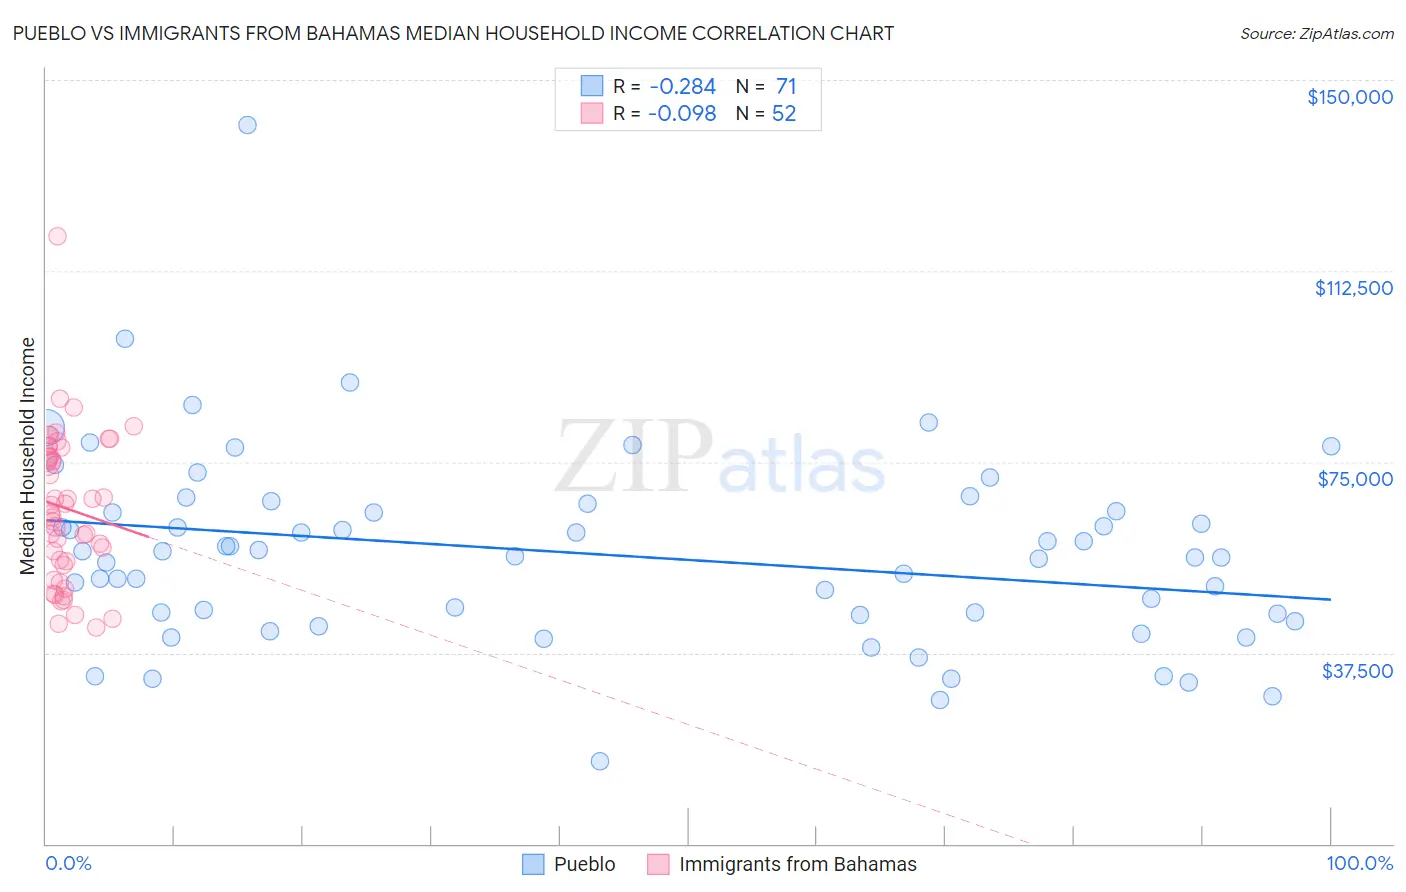
Pueblo vs Immigrants from Bahamas Median Household Income Correlation Chart
The statistical analysis conducted on geographies consisting of 120,058,820 people shows a weak negative correlation between the proportion of Pueblo and median household income in the United States with a correlation coefficient (R) of -0.284 and weighted average of $64,692. Similarly, the statistical analysis conducted on geographies consisting of 104,583,931 people shows a slight negative correlation between the proportion of Immigrants from Bahamas and median household income in the United States with a correlation coefficient (R) of -0.098 and weighted average of $71,349, a difference of 10.3%.
Median Household Income Correlation Summary
| Measurement | Pueblo | Immigrants from Bahamas |
| Minimum | $16,250 | $42,496 |
| Maximum | $141,139 | $119,201 |
| Range | $124,889 | $76,705 |
| Mean | $56,992 | $65,863 |
| Median | $56,397 | $65,628 |
| Interquartile 25% (IQ1) | $44,868 | $55,065 |
| Interquartile 75% (IQ3) | $65,216 | $76,891 |
| Interquartile Range (IQR) | $20,348 | $21,825 |
| Standard Deviation (Sample) | $19,041 | $14,679 |
| Standard Deviation (Population) | $18,906 | $14,537 |
Similar Demographics by Median Household Income
Demographics Similar to Pueblo by Median Household Income
In terms of median household income, the demographic groups most similar to Pueblo are Hopi ($65,043, a difference of 0.54%), Immigrants from Yemen ($65,194, a difference of 0.78%), Crow ($63,681, a difference of 1.6%), Kiowa ($65,914, a difference of 1.9%), and Pima ($63,262, a difference of 2.3%).
| Demographics | Rating | Rank | Median Household Income |
| Creek | 0.0 /100 | #333 | Tragic $67,715 |
| Blacks/African Americans | 0.0 /100 | #334 | Tragic $67,573 |
| Cheyenne | 0.0 /100 | #335 | Tragic $66,974 |
| Immigrants | Congo | 0.0 /100 | #336 | Tragic $66,768 |
| Kiowa | 0.0 /100 | #337 | Tragic $65,914 |
| Immigrants | Yemen | 0.0 /100 | #338 | Tragic $65,194 |
| Hopi | 0.0 /100 | #339 | Tragic $65,043 |
| Pueblo | 0.0 /100 | #340 | Tragic $64,692 |
| Crow | 0.0 /100 | #341 | Tragic $63,681 |
| Pima | 0.0 /100 | #342 | Tragic $63,262 |
| Houma | 0.0 /100 | #343 | Tragic $62,575 |
| Tohono O'odham | 0.0 /100 | #344 | Tragic $61,663 |
| Puerto Ricans | 0.0 /100 | #345 | Tragic $59,197 |
| Navajo | 0.0 /100 | #346 | Tragic $59,159 |
| Lumbee | 0.0 /100 | #347 | Tragic $54,644 |
Demographics Similar to Immigrants from Bahamas by Median Household Income
In terms of median household income, the demographic groups most similar to Immigrants from Bahamas are Dominican ($71,302, a difference of 0.060%), Immigrants from Honduras ($71,452, a difference of 0.15%), Ottawa ($70,984, a difference of 0.51%), Apache ($70,927, a difference of 0.59%), and Immigrants from Zaire ($71,801, a difference of 0.63%).
| Demographics | Rating | Rank | Median Household Income |
| Potawatomi | 0.0 /100 | #306 | Tragic $72,576 |
| Ute | 0.0 /100 | #307 | Tragic $72,402 |
| Yakama | 0.0 /100 | #308 | Tragic $72,225 |
| Immigrants | Caribbean | 0.0 /100 | #309 | Tragic $71,860 |
| U.S. Virgin Islanders | 0.0 /100 | #310 | Tragic $71,853 |
| Immigrants | Zaire | 0.0 /100 | #311 | Tragic $71,801 |
| Immigrants | Honduras | 0.0 /100 | #312 | Tragic $71,452 |
| Immigrants | Bahamas | 0.0 /100 | #313 | Tragic $71,349 |
| Dominicans | 0.0 /100 | #314 | Tragic $71,302 |
| Ottawa | 0.0 /100 | #315 | Tragic $70,984 |
| Apache | 0.0 /100 | #316 | Tragic $70,927 |
| Cajuns | 0.0 /100 | #317 | Tragic $70,605 |
| Chippewa | 0.0 /100 | #318 | Tragic $70,539 |
| Immigrants | Dominican Republic | 0.0 /100 | #319 | Tragic $70,208 |
| Colville | 0.0 /100 | #320 | Tragic $70,094 |