Northern European vs Guyanese Median Female Earnings
COMPARE
Northern European
Guyanese
Median Female Earnings
Median Female Earnings Comparison
Northern Europeans
Guyanese
$40,491
MEDIAN FEMALE EARNINGS
83.9/ 100
METRIC RATING
143rd/ 347
METRIC RANK
$40,973
MEDIAN FEMALE EARNINGS
93.4/ 100
METRIC RATING
123rd/ 347
METRIC RANK
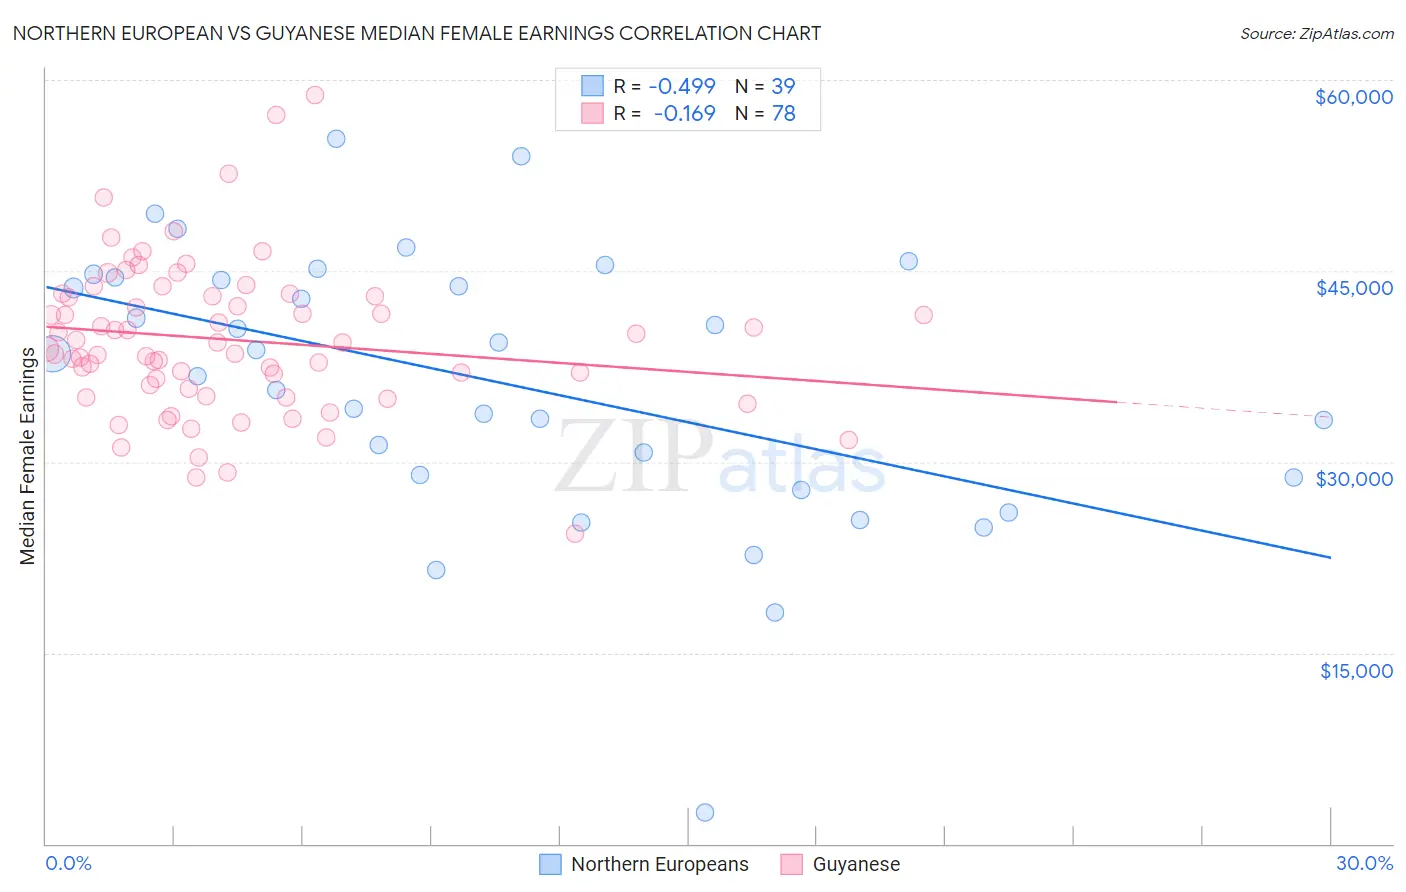
Northern European vs Guyanese Median Female Earnings Correlation Chart
The statistical analysis conducted on geographies consisting of 405,763,139 people shows a moderate negative correlation between the proportion of Northern Europeans and median female earnings in the United States with a correlation coefficient (R) of -0.499 and weighted average of $40,491. Similarly, the statistical analysis conducted on geographies consisting of 176,910,004 people shows a poor negative correlation between the proportion of Guyanese and median female earnings in the United States with a correlation coefficient (R) of -0.169 and weighted average of $40,973, a difference of 1.2%.
Median Female Earnings Correlation Summary
| Measurement | Northern European | Guyanese |
| Minimum | $2,499 | $24,336 |
| Maximum | $55,429 | $58,839 |
| Range | $52,930 | $34,503 |
| Mean | $36,265 | $39,580 |
| Median | $38,502 | $39,093 |
| Interquartile 25% (IQ1) | $28,750 | $35,732 |
| Interquartile 75% (IQ3) | $44,474 | $43,057 |
| Interquartile Range (IQR) | $15,724 | $7,325 |
| Standard Deviation (Sample) | $10,785 | $6,016 |
| Standard Deviation (Population) | $10,645 | $5,977 |
Demographics Similar to Northern Europeans and Guyanese by Median Female Earnings
In terms of median female earnings, the demographic groups most similar to Northern Europeans are Sri Lankan ($40,496, a difference of 0.010%), Immigrants from Syria ($40,499, a difference of 0.020%), Serbian ($40,539, a difference of 0.12%), Immigrants from South Eastern Asia ($40,558, a difference of 0.17%), and Taiwanese ($40,576, a difference of 0.21%). Similarly, the demographic groups most similar to Guyanese are Trinidadian and Tobagonian ($40,958, a difference of 0.040%), Austrian ($40,923, a difference of 0.12%), Immigrants from Trinidad and Tobago ($40,895, a difference of 0.19%), Ugandan ($40,889, a difference of 0.21%), and Carpatho Rusyn ($40,825, a difference of 0.36%).
| Demographics | Rating | Rank | Median Female Earnings |
| Guyanese | 93.4 /100 | #123 | Exceptional $40,973 |
| Trinidadians and Tobagonians | 93.2 /100 | #124 | Exceptional $40,958 |
| Austrians | 92.7 /100 | #125 | Exceptional $40,923 |
| Immigrants | Trinidad and Tobago | 92.3 /100 | #126 | Exceptional $40,895 |
| Ugandans | 92.2 /100 | #127 | Exceptional $40,889 |
| Carpatho Rusyns | 91.2 /100 | #128 | Exceptional $40,825 |
| Zimbabweans | 90.8 /100 | #129 | Exceptional $40,798 |
| Immigrants | Guyana | 90.3 /100 | #130 | Exceptional $40,773 |
| Chileans | 90.0 /100 | #131 | Exceptional $40,757 |
| Immigrants | Uganda | 89.7 /100 | #132 | Excellent $40,739 |
| Syrians | 89.5 /100 | #133 | Excellent $40,727 |
| Arabs | 89.3 /100 | #134 | Excellent $40,718 |
| Immigrants | Nepal | 89.0 /100 | #135 | Excellent $40,704 |
| Immigrants | Eastern Africa | 87.7 /100 | #136 | Excellent $40,644 |
| Pakistanis | 86.6 /100 | #137 | Excellent $40,596 |
| Taiwanese | 86.1 /100 | #138 | Excellent $40,576 |
| Immigrants | South Eastern Asia | 85.7 /100 | #139 | Excellent $40,558 |
| Serbians | 85.2 /100 | #140 | Excellent $40,539 |
| Immigrants | Syria | 84.1 /100 | #141 | Excellent $40,499 |
| Sri Lankans | 84.0 /100 | #142 | Excellent $40,496 |
| Northern Europeans | 83.9 /100 | #143 | Excellent $40,491 |