Mexican American Indian vs Guyanese Median Female Earnings
COMPARE
Mexican American Indian
Guyanese
Median Female Earnings
Median Female Earnings Comparison
Mexican American Indians
Guyanese
$35,629
MEDIAN FEMALE EARNINGS
0.0/ 100
METRIC RATING
296th/ 347
METRIC RANK
$40,973
MEDIAN FEMALE EARNINGS
93.4/ 100
METRIC RATING
123rd/ 347
METRIC RANK
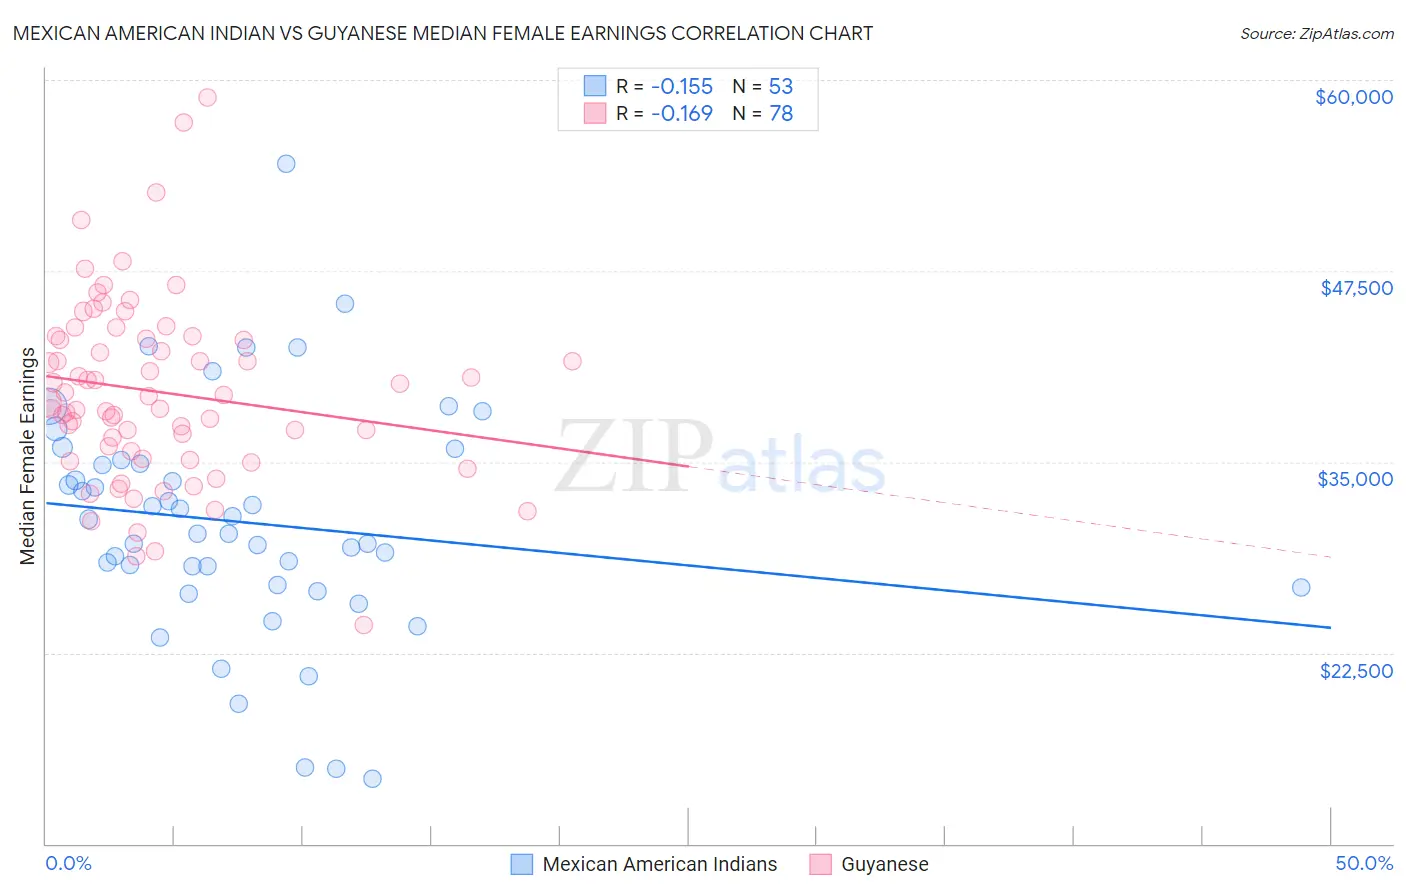
Mexican American Indian vs Guyanese Median Female Earnings Correlation Chart
The statistical analysis conducted on geographies consisting of 317,476,651 people shows a poor negative correlation between the proportion of Mexican American Indians and median female earnings in the United States with a correlation coefficient (R) of -0.155 and weighted average of $35,629. Similarly, the statistical analysis conducted on geographies consisting of 176,910,004 people shows a poor negative correlation between the proportion of Guyanese and median female earnings in the United States with a correlation coefficient (R) of -0.169 and weighted average of $40,973, a difference of 15.0%.
Median Female Earnings Correlation Summary
| Measurement | Mexican American Indian | Guyanese |
| Minimum | $14,250 | $24,336 |
| Maximum | $54,477 | $58,839 |
| Range | $40,227 | $34,503 |
| Mean | $31,030 | $39,580 |
| Median | $30,267 | $39,093 |
| Interquartile 25% (IQ1) | $26,842 | $35,732 |
| Interquartile 75% (IQ3) | $35,013 | $43,057 |
| Interquartile Range (IQR) | $8,171 | $7,325 |
| Standard Deviation (Sample) | $7,625 | $6,016 |
| Standard Deviation (Population) | $7,553 | $5,977 |
Similar Demographics by Median Female Earnings
Demographics Similar to Mexican American Indians by Median Female Earnings
In terms of median female earnings, the demographic groups most similar to Mexican American Indians are Comanche ($35,661, a difference of 0.090%), Cheyenne ($35,673, a difference of 0.12%), Guatemalan ($35,695, a difference of 0.19%), Hmong ($35,498, a difference of 0.37%), and American ($35,777, a difference of 0.42%).
| Demographics | Rating | Rank | Median Female Earnings |
| Bangladeshis | 0.0 /100 | #289 | Tragic $35,960 |
| Central American Indians | 0.0 /100 | #290 | Tragic $35,930 |
| Blackfeet | 0.0 /100 | #291 | Tragic $35,864 |
| Americans | 0.0 /100 | #292 | Tragic $35,777 |
| Guatemalans | 0.0 /100 | #293 | Tragic $35,695 |
| Cheyenne | 0.0 /100 | #294 | Tragic $35,673 |
| Comanche | 0.0 /100 | #295 | Tragic $35,661 |
| Mexican American Indians | 0.0 /100 | #296 | Tragic $35,629 |
| Hmong | 0.0 /100 | #297 | Tragic $35,498 |
| Immigrants | Micronesia | 0.0 /100 | #298 | Tragic $35,477 |
| Immigrants | Guatemala | 0.0 /100 | #299 | Tragic $35,444 |
| Yuman | 0.0 /100 | #300 | Tragic $35,377 |
| Pima | 0.0 /100 | #301 | Tragic $35,326 |
| Blacks/African Americans | 0.0 /100 | #302 | Tragic $35,315 |
| Immigrants | Latin America | 0.0 /100 | #303 | Tragic $35,307 |
Demographics Similar to Guyanese by Median Female Earnings
In terms of median female earnings, the demographic groups most similar to Guyanese are Immigrants from Jordan ($40,977, a difference of 0.010%), Trinidadian and Tobagonian ($40,958, a difference of 0.040%), Croatian ($40,993, a difference of 0.050%), Austrian ($40,923, a difference of 0.12%), and Immigrants from Trinidad and Tobago ($40,895, a difference of 0.19%).
| Demographics | Rating | Rank | Median Female Earnings |
| Immigrants | Brazil | 96.4 /100 | #116 | Exceptional $41,273 |
| Barbadians | 96.3 /100 | #117 | Exceptional $41,261 |
| Immigrants | Lebanon | 95.6 /100 | #118 | Exceptional $41,183 |
| Immigrants | Philippines | 95.0 /100 | #119 | Exceptional $41,114 |
| Immigrants | Kuwait | 94.4 /100 | #120 | Exceptional $41,055 |
| Croatians | 93.7 /100 | #121 | Exceptional $40,993 |
| Immigrants | Jordan | 93.5 /100 | #122 | Exceptional $40,977 |
| Guyanese | 93.4 /100 | #123 | Exceptional $40,973 |
| Trinidadians and Tobagonians | 93.2 /100 | #124 | Exceptional $40,958 |
| Austrians | 92.7 /100 | #125 | Exceptional $40,923 |
| Immigrants | Trinidad and Tobago | 92.3 /100 | #126 | Exceptional $40,895 |
| Ugandans | 92.2 /100 | #127 | Exceptional $40,889 |
| Carpatho Rusyns | 91.2 /100 | #128 | Exceptional $40,825 |
| Zimbabweans | 90.8 /100 | #129 | Exceptional $40,798 |
| Immigrants | Guyana | 90.3 /100 | #130 | Exceptional $40,773 |