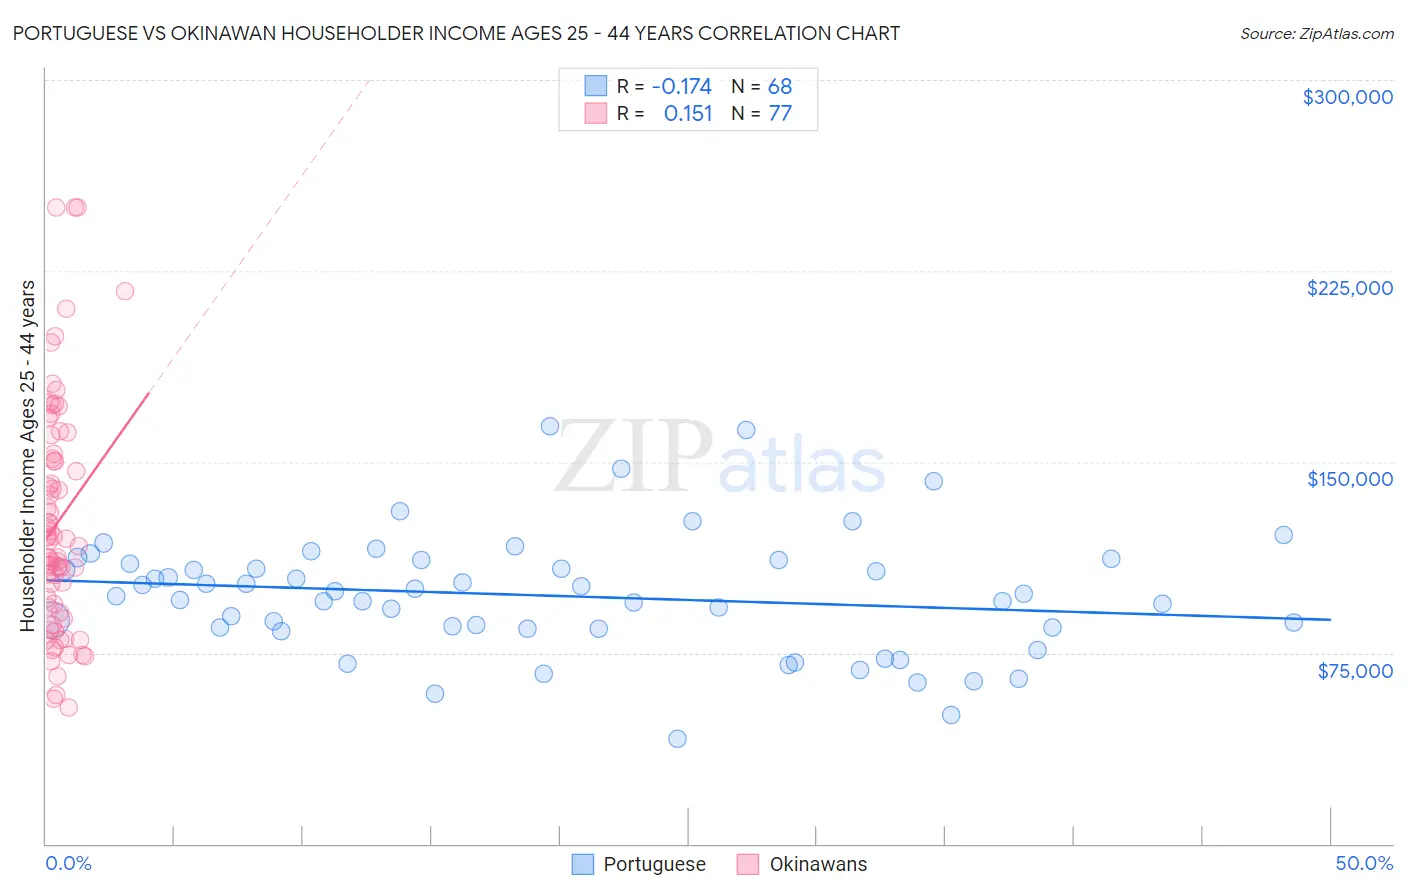
Portuguese vs Okinawan Householder Income Ages 25 - 44 years
COMPARE
Portuguese
Okinawan
Householder Income Ages 25 - 44 years
Householder Income Ages 25 - 44 years Comparison
Portuguese
Okinawans
$99,429
HOUSEHOLDER INCOME AGES 25 - 44 YEARS
93.7/ 100
METRIC RATING
116th/ 347
METRIC RANK
$119,349
HOUSEHOLDER INCOME AGES 25 - 44 YEARS
100.0/ 100
METRIC RATING
11th/ 347
METRIC RANK
Portuguese vs Okinawan Householder Income Ages 25 - 44 years Correlation Chart
The statistical analysis conducted on geographies consisting of 448,408,954 people shows a poor negative correlation between the proportion of Portuguese and household income with householder between the ages 25 and 44 in the United States with a correlation coefficient (R) of -0.174 and weighted average of $99,429. Similarly, the statistical analysis conducted on geographies consisting of 73,689,702 people shows a poor positive correlation between the proportion of Okinawans and household income with householder between the ages 25 and 44 in the United States with a correlation coefficient (R) of 0.151 and weighted average of $119,349, a difference of 20.0%.
Householder Income Ages 25 - 44 years Correlation Summary
| Measurement | Portuguese | Okinawan |
| Minimum | $41,033 | $53,516 |
| Maximum | $164,238 | $250,001 |
| Range | $123,205 | $196,485 |
| Mean | $97,431 | $126,213 |
| Median | $97,526 | $118,882 |
| Interquartile 25% (IQ1) | $84,648 | $91,836 |
| Interquartile 75% (IQ3) | $110,670 | $152,291 |
| Interquartile Range (IQR) | $26,022 | $60,455 |
| Standard Deviation (Sample) | $23,647 | $45,314 |
| Standard Deviation (Population) | $23,472 | $45,019 |
Similar Demographics by Householder Income Ages 25 - 44 years
Demographics Similar to Portuguese by Householder Income Ages 25 - 44 years
In terms of householder income ages 25 - 44 years, the demographic groups most similar to Portuguese are Carpatho Rusyn ($99,449, a difference of 0.020%), Immigrants from Western Asia ($99,516, a difference of 0.090%), Tongan ($99,604, a difference of 0.18%), Immigrants from Northern Africa ($99,232, a difference of 0.20%), and Syrian ($99,215, a difference of 0.22%).
| Demographics | Rating | Rank | Householder Income Ages 25 - 44 years |
| Immigrants | North Macedonia | 95.6 /100 | #109 | Exceptional $100,101 |
| Immigrants | Afghanistan | 95.3 /100 | #110 | Exceptional $99,977 |
| Chileans | 95.1 /100 | #111 | Exceptional $99,900 |
| Poles | 94.5 /100 | #112 | Exceptional $99,685 |
| Tongans | 94.2 /100 | #113 | Exceptional $99,604 |
| Immigrants | Western Asia | 94.0 /100 | #114 | Exceptional $99,516 |
| Carpatho Rusyns | 93.7 /100 | #115 | Exceptional $99,449 |
| Portuguese | 93.7 /100 | #116 | Exceptional $99,429 |
| Immigrants | Northern Africa | 93.0 /100 | #117 | Exceptional $99,232 |
| Syrians | 92.9 /100 | #118 | Exceptional $99,215 |
| Jordanians | 92.8 /100 | #119 | Exceptional $99,186 |
| Swedes | 92.7 /100 | #120 | Exceptional $99,136 |
| Peruvians | 91.7 /100 | #121 | Exceptional $98,886 |
| Immigrants | Uzbekistan | 91.5 /100 | #122 | Exceptional $98,849 |
| Palestinians | 91.2 /100 | #123 | Exceptional $98,777 |
Demographics Similar to Okinawans by Householder Income Ages 25 - 44 years
In terms of householder income ages 25 - 44 years, the demographic groups most similar to Okinawans are Indian (Asian) ($119,496, a difference of 0.12%), Immigrants from Iran ($119,204, a difference of 0.12%), Immigrants from China ($119,756, a difference of 0.34%), Iranian ($120,292, a difference of 0.79%), and Immigrants from Ireland ($120,333, a difference of 0.82%).
| Demographics | Rating | Rank | Householder Income Ages 25 - 44 years |
| Immigrants | Singapore | 100.0 /100 | #4 | Exceptional $124,429 |
| Immigrants | India | 100.0 /100 | #5 | Exceptional $124,238 |
| Thais | 100.0 /100 | #6 | Exceptional $121,778 |
| Immigrants | Ireland | 100.0 /100 | #7 | Exceptional $120,333 |
| Iranians | 100.0 /100 | #8 | Exceptional $120,292 |
| Immigrants | China | 100.0 /100 | #9 | Exceptional $119,756 |
| Indians (Asian) | 100.0 /100 | #10 | Exceptional $119,496 |
| Okinawans | 100.0 /100 | #11 | Exceptional $119,349 |
| Immigrants | Iran | 100.0 /100 | #12 | Exceptional $119,204 |
| Immigrants | Eastern Asia | 100.0 /100 | #13 | Exceptional $118,056 |
| Immigrants | Israel | 100.0 /100 | #14 | Exceptional $117,219 |
| Immigrants | South Central Asia | 100.0 /100 | #15 | Exceptional $116,626 |
| Cypriots | 100.0 /100 | #16 | Exceptional $116,364 |
| Immigrants | Australia | 100.0 /100 | #17 | Exceptional $115,947 |
| Eastern Europeans | 100.0 /100 | #18 | Exceptional $114,523 |