Portuguese vs French American Indian Householder Income Ages 25 - 44 years
COMPARE
Portuguese
French American Indian
Householder Income Ages 25 - 44 years
Householder Income Ages 25 - 44 years Comparison
Portuguese
French American Indians
$99,429
HOUSEHOLDER INCOME AGES 25 - 44 YEARS
93.7/ 100
METRIC RATING
116th/ 347
METRIC RANK
$85,899
HOUSEHOLDER INCOME AGES 25 - 44 YEARS
0.8/ 100
METRIC RATING
249th/ 347
METRIC RANK
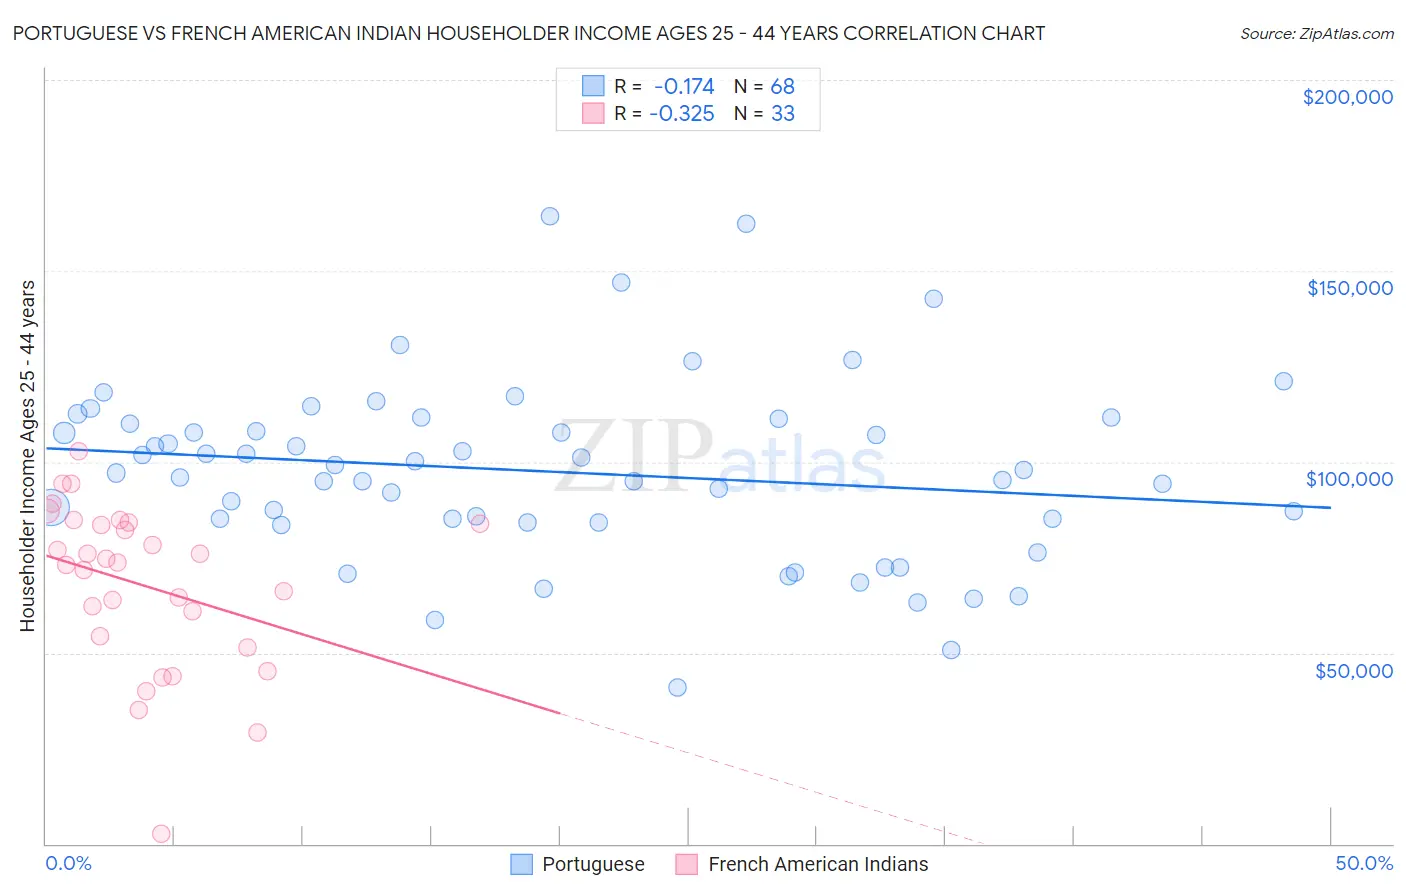
Portuguese vs French American Indian Householder Income Ages 25 - 44 years Correlation Chart
The statistical analysis conducted on geographies consisting of 448,408,954 people shows a poor negative correlation between the proportion of Portuguese and household income with householder between the ages 25 and 44 in the United States with a correlation coefficient (R) of -0.174 and weighted average of $99,429. Similarly, the statistical analysis conducted on geographies consisting of 131,864,542 people shows a mild negative correlation between the proportion of French American Indians and household income with householder between the ages 25 and 44 in the United States with a correlation coefficient (R) of -0.325 and weighted average of $85,899, a difference of 15.8%.
Householder Income Ages 25 - 44 years Correlation Summary
| Measurement | Portuguese | French American Indian |
| Minimum | $41,033 | $2,499 |
| Maximum | $164,238 | $102,898 |
| Range | $123,205 | $100,399 |
| Mean | $97,431 | $67,668 |
| Median | $97,526 | $73,750 |
| Interquartile 25% (IQ1) | $84,648 | $52,805 |
| Interquartile 75% (IQ3) | $110,670 | $84,046 |
| Interquartile Range (IQR) | $26,022 | $31,241 |
| Standard Deviation (Sample) | $23,647 | $21,873 |
| Standard Deviation (Population) | $23,472 | $21,539 |
Similar Demographics by Householder Income Ages 25 - 44 years
Demographics Similar to Portuguese by Householder Income Ages 25 - 44 years
In terms of householder income ages 25 - 44 years, the demographic groups most similar to Portuguese are Carpatho Rusyn ($99,449, a difference of 0.020%), Immigrants from Western Asia ($99,516, a difference of 0.090%), Tongan ($99,604, a difference of 0.18%), Immigrants from Northern Africa ($99,232, a difference of 0.20%), and Syrian ($99,215, a difference of 0.22%).
| Demographics | Rating | Rank | Householder Income Ages 25 - 44 years |
| Immigrants | North Macedonia | 95.6 /100 | #109 | Exceptional $100,101 |
| Immigrants | Afghanistan | 95.3 /100 | #110 | Exceptional $99,977 |
| Chileans | 95.1 /100 | #111 | Exceptional $99,900 |
| Poles | 94.5 /100 | #112 | Exceptional $99,685 |
| Tongans | 94.2 /100 | #113 | Exceptional $99,604 |
| Immigrants | Western Asia | 94.0 /100 | #114 | Exceptional $99,516 |
| Carpatho Rusyns | 93.7 /100 | #115 | Exceptional $99,449 |
| Portuguese | 93.7 /100 | #116 | Exceptional $99,429 |
| Immigrants | Northern Africa | 93.0 /100 | #117 | Exceptional $99,232 |
| Syrians | 92.9 /100 | #118 | Exceptional $99,215 |
| Jordanians | 92.8 /100 | #119 | Exceptional $99,186 |
| Swedes | 92.7 /100 | #120 | Exceptional $99,136 |
| Peruvians | 91.7 /100 | #121 | Exceptional $98,886 |
| Immigrants | Uzbekistan | 91.5 /100 | #122 | Exceptional $98,849 |
| Palestinians | 91.2 /100 | #123 | Exceptional $98,777 |
Demographics Similar to French American Indians by Householder Income Ages 25 - 44 years
In terms of householder income ages 25 - 44 years, the demographic groups most similar to French American Indians are Pennsylvania German ($85,836, a difference of 0.070%), Cape Verdean ($85,758, a difference of 0.16%), Immigrants from Sudan ($86,109, a difference of 0.24%), Immigrants from Western Africa ($85,676, a difference of 0.26%), and British West Indian ($85,565, a difference of 0.39%).
| Demographics | Rating | Rank | Householder Income Ages 25 - 44 years |
| West Indians | 1.7 /100 | #242 | Tragic $87,205 |
| Immigrants | West Indies | 1.5 /100 | #243 | Tragic $87,063 |
| Immigrants | Venezuela | 1.5 /100 | #244 | Tragic $87,038 |
| Immigrants | El Salvador | 1.4 /100 | #245 | Tragic $86,913 |
| Immigrants | Burma/Myanmar | 1.3 /100 | #246 | Tragic $86,736 |
| Immigrants | Nigeria | 1.2 /100 | #247 | Tragic $86,589 |
| Immigrants | Sudan | 0.9 /100 | #248 | Tragic $86,109 |
| French American Indians | 0.8 /100 | #249 | Tragic $85,899 |
| Pennsylvania Germans | 0.8 /100 | #250 | Tragic $85,836 |
| Cape Verdeans | 0.8 /100 | #251 | Tragic $85,758 |
| Immigrants | Western Africa | 0.7 /100 | #252 | Tragic $85,676 |
| British West Indians | 0.7 /100 | #253 | Tragic $85,565 |
| Immigrants | Laos | 0.7 /100 | #254 | Tragic $85,553 |
| German Russians | 0.6 /100 | #255 | Tragic $85,220 |
| Central Americans | 0.5 /100 | #256 | Tragic $85,144 |