Immigrants from Belize vs Alaska Native Per Capita Income
COMPARE
Immigrants from Belize
Alaska Native
Per Capita Income
Per Capita Income Comparison
Immigrants from Belize
Alaska Natives
$38,614
PER CAPITA INCOME
0.3/ 100
METRIC RATING
270th/ 347
METRIC RANK
$39,558
PER CAPITA INCOME
1.0/ 100
METRIC RATING
254th/ 347
METRIC RANK
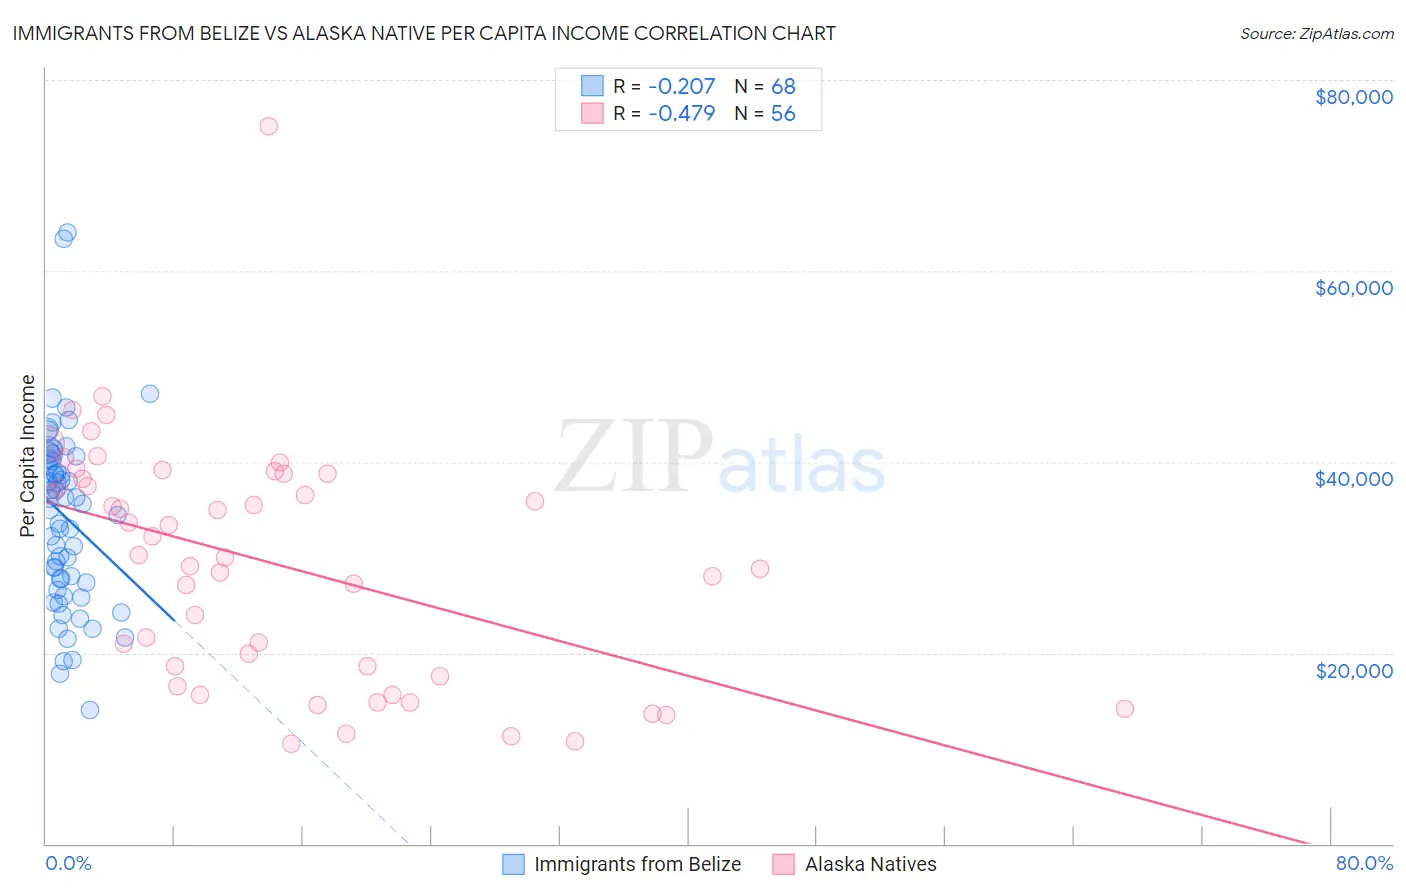
Immigrants from Belize vs Alaska Native Per Capita Income Correlation Chart
The statistical analysis conducted on geographies consisting of 130,314,146 people shows a weak negative correlation between the proportion of Immigrants from Belize and per capita income in the United States with a correlation coefficient (R) of -0.207 and weighted average of $38,614. Similarly, the statistical analysis conducted on geographies consisting of 76,776,237 people shows a moderate negative correlation between the proportion of Alaska Natives and per capita income in the United States with a correlation coefficient (R) of -0.479 and weighted average of $39,558, a difference of 2.5%.
Per Capita Income Correlation Summary
| Measurement | Immigrants from Belize | Alaska Native |
| Minimum | $13,974 | $10,456 |
| Maximum | $63,996 | $75,144 |
| Range | $50,022 | $64,688 |
| Mean | $34,271 | $29,356 |
| Median | $35,906 | $30,080 |
| Interquartile 25% (IQ1) | $27,515 | $18,080 |
| Interquartile 75% (IQ3) | $40,202 | $38,478 |
| Interquartile Range (IQR) | $12,687 | $20,399 |
| Standard Deviation (Sample) | $9,371 | $12,502 |
| Standard Deviation (Population) | $9,302 | $12,390 |
Demographics Similar to Immigrants from Belize and Alaska Natives by Per Capita Income
In terms of per capita income, the demographic groups most similar to Immigrants from Belize are Central American ($38,560, a difference of 0.14%), Immigrants from Cabo Verde ($38,540, a difference of 0.19%), Immigrants from Jamaica ($38,766, a difference of 0.39%), Liberian ($38,780, a difference of 0.43%), and Immigrants from Zaire ($38,848, a difference of 0.61%). Similarly, the demographic groups most similar to Alaska Natives are Osage ($39,568, a difference of 0.020%), Immigrants from Middle Africa ($39,529, a difference of 0.070%), Immigrants from the Azores ($39,608, a difference of 0.13%), Hawaiian ($39,403, a difference of 0.39%), and Nicaraguan ($39,372, a difference of 0.47%).
| Demographics | Rating | Rank | Per Capita Income |
| Immigrants | Azores | 1.0 /100 | #252 | Tragic $39,608 |
| Osage | 1.0 /100 | #253 | Tragic $39,568 |
| Alaska Natives | 1.0 /100 | #254 | Tragic $39,558 |
| Immigrants | Middle Africa | 1.0 /100 | #255 | Tragic $39,529 |
| Hawaiians | 0.8 /100 | #256 | Tragic $39,403 |
| Nicaraguans | 0.8 /100 | #257 | Tragic $39,372 |
| Jamaicans | 0.7 /100 | #258 | Tragic $39,231 |
| Malaysians | 0.7 /100 | #259 | Tragic $39,194 |
| Alaskan Athabascans | 0.6 /100 | #260 | Tragic $39,163 |
| Marshallese | 0.6 /100 | #261 | Tragic $39,108 |
| Iroquois | 0.6 /100 | #262 | Tragic $39,104 |
| Belizeans | 0.6 /100 | #263 | Tragic $39,097 |
| Americans | 0.6 /100 | #264 | Tragic $39,039 |
| Spanish Americans | 0.5 /100 | #265 | Tragic $39,012 |
| Salvadorans | 0.5 /100 | #266 | Tragic $38,858 |
| Immigrants | Zaire | 0.4 /100 | #267 | Tragic $38,848 |
| Liberians | 0.4 /100 | #268 | Tragic $38,780 |
| Immigrants | Jamaica | 0.4 /100 | #269 | Tragic $38,766 |
| Immigrants | Belize | 0.3 /100 | #270 | Tragic $38,614 |
| Central Americans | 0.3 /100 | #271 | Tragic $38,560 |
| Immigrants | Cabo Verde | 0.3 /100 | #272 | Tragic $38,540 |