Immigrants from Germany vs Cheyenne Median Household Income
COMPARE
Immigrants from Germany
Cheyenne
Median Household Income
Median Household Income Comparison
Immigrants from Germany
Cheyenne
$86,764
MEDIAN HOUSEHOLD INCOME
74.4/ 100
METRIC RATING
154th/ 347
METRIC RANK
$66,974
MEDIAN HOUSEHOLD INCOME
0.0/ 100
METRIC RATING
335th/ 347
METRIC RANK
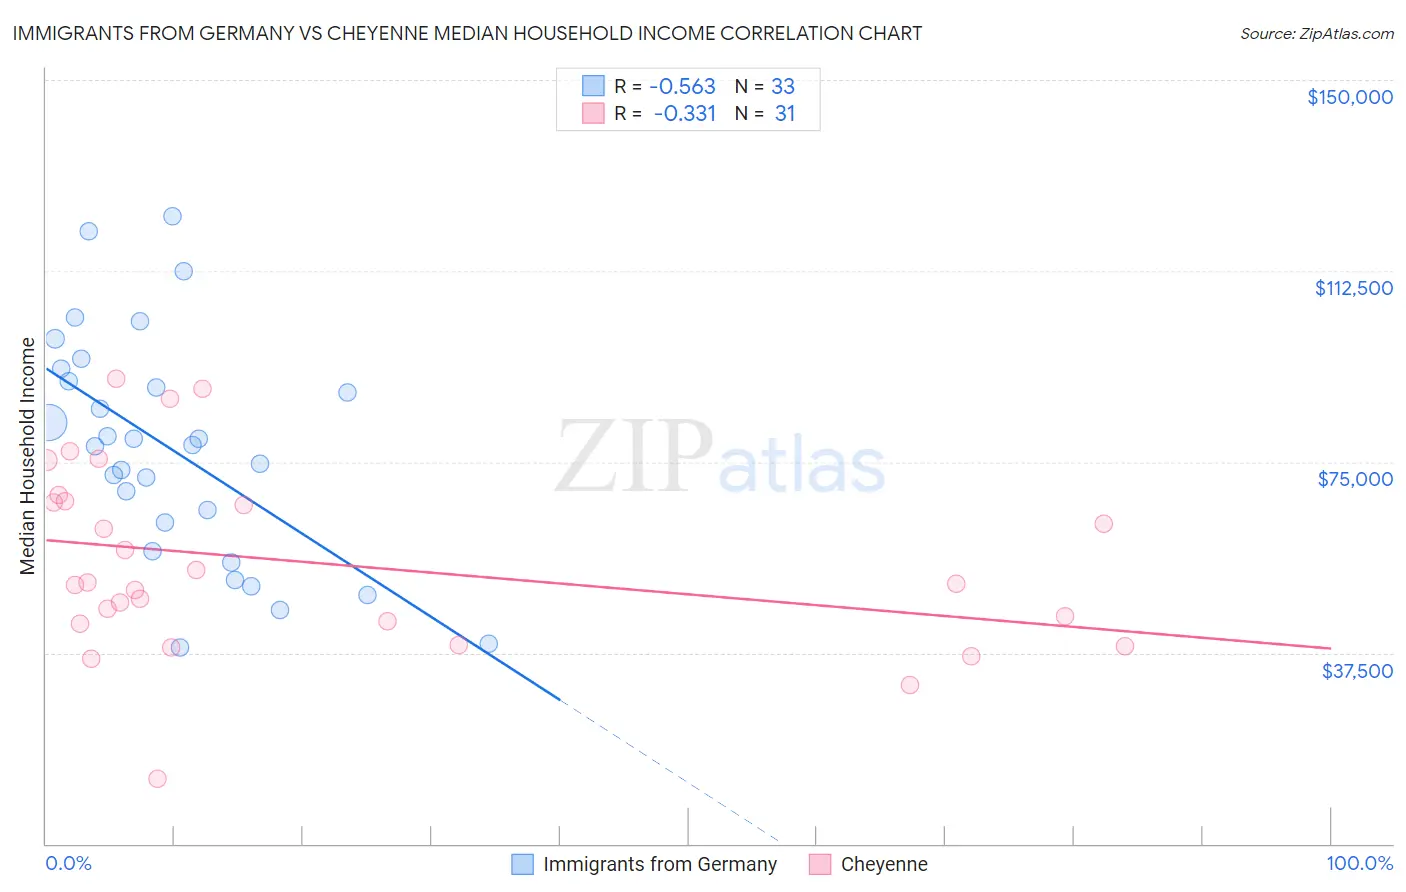
Immigrants from Germany vs Cheyenne Median Household Income Correlation Chart
The statistical analysis conducted on geographies consisting of 463,670,643 people shows a substantial negative correlation between the proportion of Immigrants from Germany and median household income in the United States with a correlation coefficient (R) of -0.563 and weighted average of $86,764. Similarly, the statistical analysis conducted on geographies consisting of 80,700,473 people shows a mild negative correlation between the proportion of Cheyenne and median household income in the United States with a correlation coefficient (R) of -0.331 and weighted average of $66,974, a difference of 29.5%.
Median Household Income Correlation Summary
| Measurement | Immigrants from Germany | Cheyenne |
| Minimum | $38,452 | $12,708 |
| Maximum | $123,192 | $91,250 |
| Range | $84,740 | $78,542 |
| Mean | $77,580 | $55,202 |
| Median | $78,375 | $51,125 |
| Interquartile 25% (IQ1) | $60,226 | $43,228 |
| Interquartile 75% (IQ3) | $92,055 | $67,262 |
| Interquartile Range (IQR) | $31,829 | $24,034 |
| Standard Deviation (Sample) | $22,106 | $18,300 |
| Standard Deviation (Population) | $21,769 | $18,003 |
Similar Demographics by Median Household Income
Demographics Similar to Immigrants from Germany by Median Household Income
In terms of median household income, the demographic groups most similar to Immigrants from Germany are South American ($86,824, a difference of 0.070%), Immigrants from Saudi Arabia ($86,875, a difference of 0.13%), Carpatho Rusyn ($86,635, a difference of 0.15%), Hungarian ($86,920, a difference of 0.18%), and Basque ($87,001, a difference of 0.27%).
| Demographics | Rating | Rank | Median Household Income |
| South American Indians | 81.8 /100 | #147 | Excellent $87,446 |
| Costa Ricans | 80.0 /100 | #148 | Excellent $87,262 |
| Immigrants | Nepal | 77.7 /100 | #149 | Good $87,046 |
| Basques | 77.2 /100 | #150 | Good $87,001 |
| Hungarians | 76.3 /100 | #151 | Good $86,920 |
| Immigrants | Saudi Arabia | 75.8 /100 | #152 | Good $86,875 |
| South Americans | 75.1 /100 | #153 | Good $86,824 |
| Immigrants | Germany | 74.4 /100 | #154 | Good $86,764 |
| Carpatho Rusyns | 72.8 /100 | #155 | Good $86,635 |
| Immigrants | Albania | 71.5 /100 | #156 | Good $86,534 |
| Samoans | 71.0 /100 | #157 | Good $86,498 |
| Moroccans | 70.6 /100 | #158 | Good $86,468 |
| Immigrants | Uzbekistan | 70.1 /100 | #159 | Good $86,425 |
| Luxembourgers | 70.0 /100 | #160 | Good $86,418 |
| Slavs | 69.7 /100 | #161 | Good $86,398 |
Demographics Similar to Cheyenne by Median Household Income
In terms of median household income, the demographic groups most similar to Cheyenne are Immigrants from Congo ($66,768, a difference of 0.31%), Black/African American ($67,573, a difference of 0.89%), Creek ($67,715, a difference of 1.1%), Sioux ($67,792, a difference of 1.2%), and Native/Alaskan ($67,879, a difference of 1.3%).
| Demographics | Rating | Rank | Median Household Income |
| Menominee | 0.0 /100 | #328 | Tragic $68,423 |
| Dutch West Indians | 0.0 /100 | #329 | Tragic $68,412 |
| Arapaho | 0.0 /100 | #330 | Tragic $67,965 |
| Natives/Alaskans | 0.0 /100 | #331 | Tragic $67,879 |
| Sioux | 0.0 /100 | #332 | Tragic $67,792 |
| Creek | 0.0 /100 | #333 | Tragic $67,715 |
| Blacks/African Americans | 0.0 /100 | #334 | Tragic $67,573 |
| Cheyenne | 0.0 /100 | #335 | Tragic $66,974 |
| Immigrants | Congo | 0.0 /100 | #336 | Tragic $66,768 |
| Kiowa | 0.0 /100 | #337 | Tragic $65,914 |
| Immigrants | Yemen | 0.0 /100 | #338 | Tragic $65,194 |
| Hopi | 0.0 /100 | #339 | Tragic $65,043 |
| Pueblo | 0.0 /100 | #340 | Tragic $64,692 |
| Crow | 0.0 /100 | #341 | Tragic $63,681 |
| Pima | 0.0 /100 | #342 | Tragic $63,262 |