Bolivian vs Alaskan Athabascan Householder Income Over 65 years
COMPARE
Bolivian
Alaskan Athabascan
Householder Income Over 65 years
Householder Income Over 65 years Comparison
Bolivians
Alaskan Athabascans
$74,245
HOUSEHOLDER INCOME OVER 65 YEARS
100.0/ 100
METRIC RATING
6th/ 347
METRIC RANK
$62,330
HOUSEHOLDER INCOME OVER 65 YEARS
80.6/ 100
METRIC RATING
136th/ 347
METRIC RANK
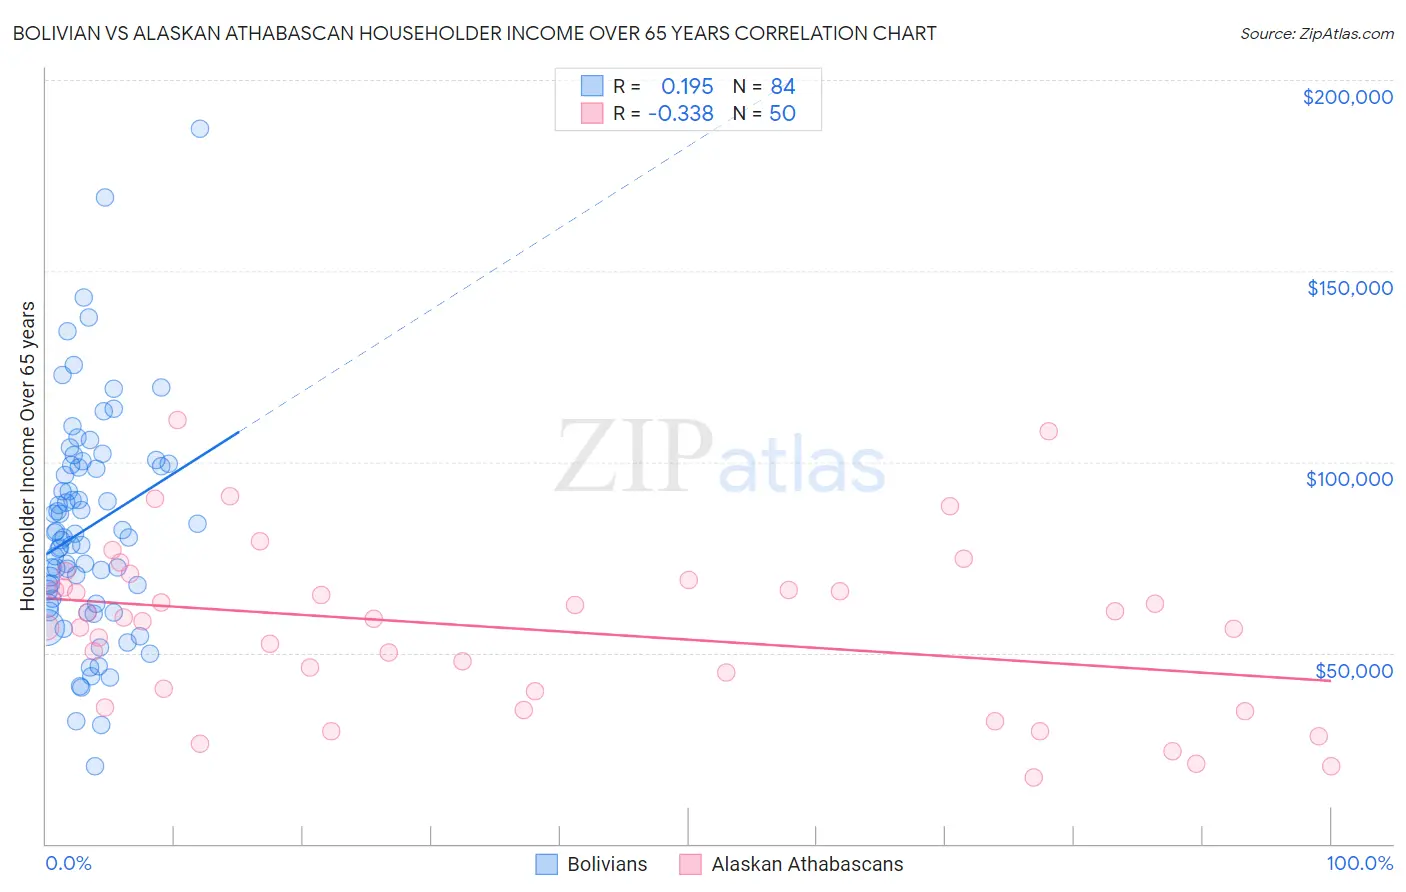
Bolivian vs Alaskan Athabascan Householder Income Over 65 years Correlation Chart
The statistical analysis conducted on geographies consisting of 184,404,037 people shows a poor positive correlation between the proportion of Bolivians and household income with householder over the age of 65 in the United States with a correlation coefficient (R) of 0.195 and weighted average of $74,245. Similarly, the statistical analysis conducted on geographies consisting of 45,769,893 people shows a mild negative correlation between the proportion of Alaskan Athabascans and household income with householder over the age of 65 in the United States with a correlation coefficient (R) of -0.338 and weighted average of $62,330, a difference of 19.1%.
Householder Income Over 65 years Correlation Summary
| Measurement | Bolivian | Alaskan Athabascan |
| Minimum | $20,142 | $17,188 |
| Maximum | $187,273 | $111,125 |
| Range | $167,131 | $93,937 |
| Mean | $82,611 | $56,372 |
| Median | $80,185 | $58,696 |
| Interquartile 25% (IQ1) | $63,404 | $40,000 |
| Interquartile 75% (IQ3) | $98,957 | $67,202 |
| Interquartile Range (IQR) | $35,553 | $27,202 |
| Standard Deviation (Sample) | $29,052 | $21,725 |
| Standard Deviation (Population) | $28,879 | $21,506 |
Similar Demographics by Householder Income Over 65 years
Demographics Similar to Bolivians by Householder Income Over 65 years
In terms of householder income over 65 years, the demographic groups most similar to Bolivians are Immigrants from Bolivia ($73,434, a difference of 1.1%), Immigrants from Iran ($75,081, a difference of 1.1%), Immigrants from Singapore ($72,963, a difference of 1.8%), Immigrants from India ($72,804, a difference of 2.0%), and Bhutanese ($72,288, a difference of 2.7%).
| Demographics | Rating | Rank | Householder Income Over 65 years |
| Chinese | 100.0 /100 | #1 | Exceptional $77,465 |
| Iranians | 100.0 /100 | #2 | Exceptional $77,429 |
| Immigrants | Taiwan | 100.0 /100 | #3 | Exceptional $77,051 |
| Filipinos | 100.0 /100 | #4 | Exceptional $76,686 |
| Immigrants | Iran | 100.0 /100 | #5 | Exceptional $75,081 |
| Bolivians | 100.0 /100 | #6 | Exceptional $74,245 |
| Immigrants | Bolivia | 100.0 /100 | #7 | Exceptional $73,434 |
| Immigrants | Singapore | 100.0 /100 | #8 | Exceptional $72,963 |
| Immigrants | India | 100.0 /100 | #9 | Exceptional $72,804 |
| Bhutanese | 100.0 /100 | #10 | Exceptional $72,288 |
| Thais | 100.0 /100 | #11 | Exceptional $72,099 |
| Cypriots | 100.0 /100 | #12 | Exceptional $71,714 |
| Immigrants | Hong Kong | 100.0 /100 | #13 | Exceptional $71,567 |
| Burmese | 100.0 /100 | #14 | Exceptional $71,139 |
| Native Hawaiians | 100.0 /100 | #15 | Exceptional $71,021 |
Demographics Similar to Alaskan Athabascans by Householder Income Over 65 years
In terms of householder income over 65 years, the demographic groups most similar to Alaskan Athabascans are Immigrants from Chile ($62,354, a difference of 0.040%), Immigrants from Syria ($62,303, a difference of 0.040%), Immigrants from Brazil ($62,364, a difference of 0.060%), Immigrants from Kazakhstan ($62,292, a difference of 0.060%), and Lebanese ($62,287, a difference of 0.070%).
| Demographics | Rating | Rank | Householder Income Over 65 years |
| Immigrants | Eastern Europe | 85.9 /100 | #129 | Excellent $62,693 |
| Basques | 85.4 /100 | #130 | Excellent $62,653 |
| Immigrants | Western Asia | 85.3 /100 | #131 | Excellent $62,645 |
| Immigrants | Germany | 83.9 /100 | #132 | Excellent $62,544 |
| Immigrants | Northern Africa | 83.6 /100 | #133 | Excellent $62,522 |
| Immigrants | Brazil | 81.2 /100 | #134 | Excellent $62,364 |
| Immigrants | Chile | 81.0 /100 | #135 | Excellent $62,354 |
| Alaskan Athabascans | 80.6 /100 | #136 | Excellent $62,330 |
| Immigrants | Syria | 80.2 /100 | #137 | Excellent $62,303 |
| Immigrants | Kazakhstan | 80.0 /100 | #138 | Excellent $62,292 |
| Lebanese | 79.9 /100 | #139 | Good $62,287 |
| Arabs | 79.6 /100 | #140 | Good $62,266 |
| Canadians | 79.0 /100 | #141 | Good $62,230 |
| South American Indians | 78.7 /100 | #142 | Good $62,215 |
| Immigrants | Belarus | 77.8 /100 | #143 | Good $62,162 |