Polish vs Immigrants from Kazakhstan Householder Income Over 65 years
COMPARE
Polish
Immigrants from Kazakhstan
Householder Income Over 65 years
Householder Income Over 65 years Comparison
Poles
Immigrants from Kazakhstan
$61,598
HOUSEHOLDER INCOME OVER 65 YEARS
65.9/ 100
METRIC RATING
155th/ 347
METRIC RANK
$62,292
HOUSEHOLDER INCOME OVER 65 YEARS
80.0/ 100
METRIC RATING
138th/ 347
METRIC RANK
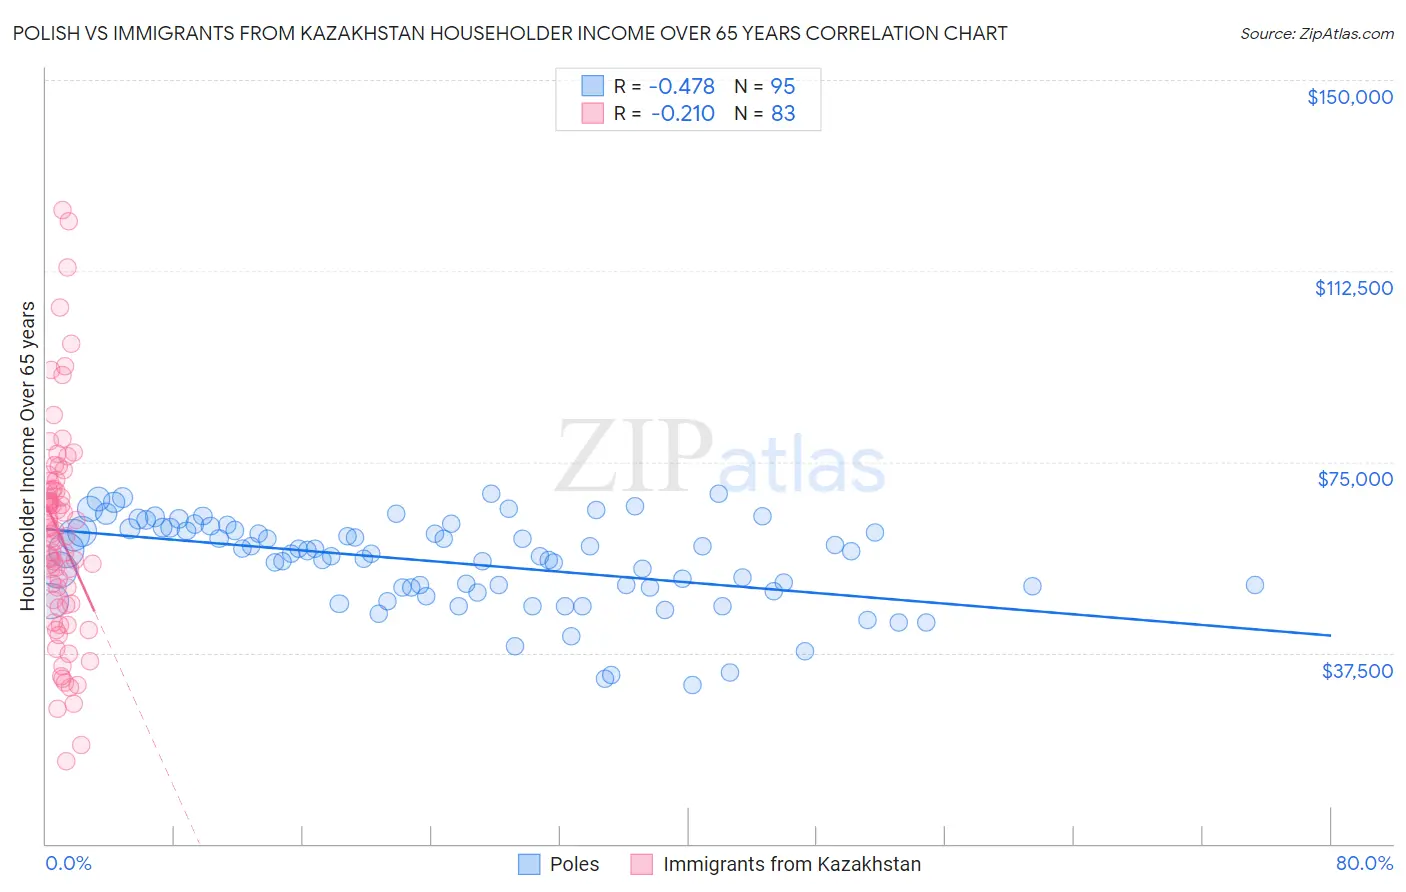
Polish vs Immigrants from Kazakhstan Householder Income Over 65 years Correlation Chart
The statistical analysis conducted on geographies consisting of 555,812,342 people shows a moderate negative correlation between the proportion of Poles and household income with householder over the age of 65 in the United States with a correlation coefficient (R) of -0.478 and weighted average of $61,598. Similarly, the statistical analysis conducted on geographies consisting of 124,347,353 people shows a weak negative correlation between the proportion of Immigrants from Kazakhstan and household income with householder over the age of 65 in the United States with a correlation coefficient (R) of -0.210 and weighted average of $62,292, a difference of 1.1%.
Householder Income Over 65 years Correlation Summary
| Measurement | Polish | Immigrants from Kazakhstan |
| Minimum | $31,125 | $16,126 |
| Maximum | $68,837 | $124,402 |
| Range | $37,712 | $108,276 |
| Mean | $55,277 | $60,647 |
| Median | $57,047 | $60,915 |
| Interquartile 25% (IQ1) | $50,250 | $46,912 |
| Interquartile 75% (IQ3) | $61,924 | $69,745 |
| Interquartile Range (IQR) | $11,674 | $22,833 |
| Standard Deviation (Sample) | $8,677 | $21,151 |
| Standard Deviation (Population) | $8,631 | $21,023 |
Demographics Similar to Poles and Immigrants from Kazakhstan by Householder Income Over 65 years
In terms of householder income over 65 years, the demographic groups most similar to Poles are Scandinavian ($61,586, a difference of 0.020%), Swiss ($61,621, a difference of 0.040%), Costa Rican ($61,638, a difference of 0.060%), Armenian ($61,656, a difference of 0.090%), and Hungarian ($61,673, a difference of 0.12%). Similarly, the demographic groups most similar to Immigrants from Kazakhstan are Lebanese ($62,287, a difference of 0.010%), Immigrants from Syria ($62,303, a difference of 0.020%), Arab ($62,266, a difference of 0.040%), Alaskan Athabascan ($62,330, a difference of 0.060%), and Canadian ($62,230, a difference of 0.10%).
| Demographics | Rating | Rank | Householder Income Over 65 years |
| Alaskan Athabascans | 80.6 /100 | #136 | Excellent $62,330 |
| Immigrants | Syria | 80.2 /100 | #137 | Excellent $62,303 |
| Immigrants | Kazakhstan | 80.0 /100 | #138 | Excellent $62,292 |
| Lebanese | 79.9 /100 | #139 | Good $62,287 |
| Arabs | 79.6 /100 | #140 | Good $62,266 |
| Canadians | 79.0 /100 | #141 | Good $62,230 |
| South American Indians | 78.7 /100 | #142 | Good $62,215 |
| Immigrants | Belarus | 77.8 /100 | #143 | Good $62,162 |
| Immigrants | Peru | 74.4 /100 | #144 | Good $61,988 |
| Immigrants | Uganda | 74.2 /100 | #145 | Good $61,976 |
| Immigrants | Southern Europe | 72.7 /100 | #146 | Good $61,902 |
| Immigrants | Nepal | 71.4 /100 | #147 | Good $61,843 |
| Alsatians | 70.5 /100 | #148 | Good $61,797 |
| Scottish | 69.1 /100 | #149 | Good $61,735 |
| Slavs | 68.5 /100 | #150 | Good $61,709 |
| Hungarians | 67.7 /100 | #151 | Good $61,673 |
| Armenians | 67.3 /100 | #152 | Good $61,656 |
| Costa Ricans | 66.9 /100 | #153 | Good $61,638 |
| Swiss | 66.5 /100 | #154 | Good $61,621 |
| Poles | 65.9 /100 | #155 | Good $61,598 |
| Scandinavians | 65.6 /100 | #156 | Good $61,586 |