Peruvian vs Alaskan Athabascan Householder Income Over 65 years
COMPARE
Peruvian
Alaskan Athabascan
Householder Income Over 65 years
Householder Income Over 65 years Comparison
Peruvians
Alaskan Athabascans
$62,766
HOUSEHOLDER INCOME OVER 65 YEARS
86.8/ 100
METRIC RATING
126th/ 347
METRIC RANK
$62,330
HOUSEHOLDER INCOME OVER 65 YEARS
80.6/ 100
METRIC RATING
136th/ 347
METRIC RANK
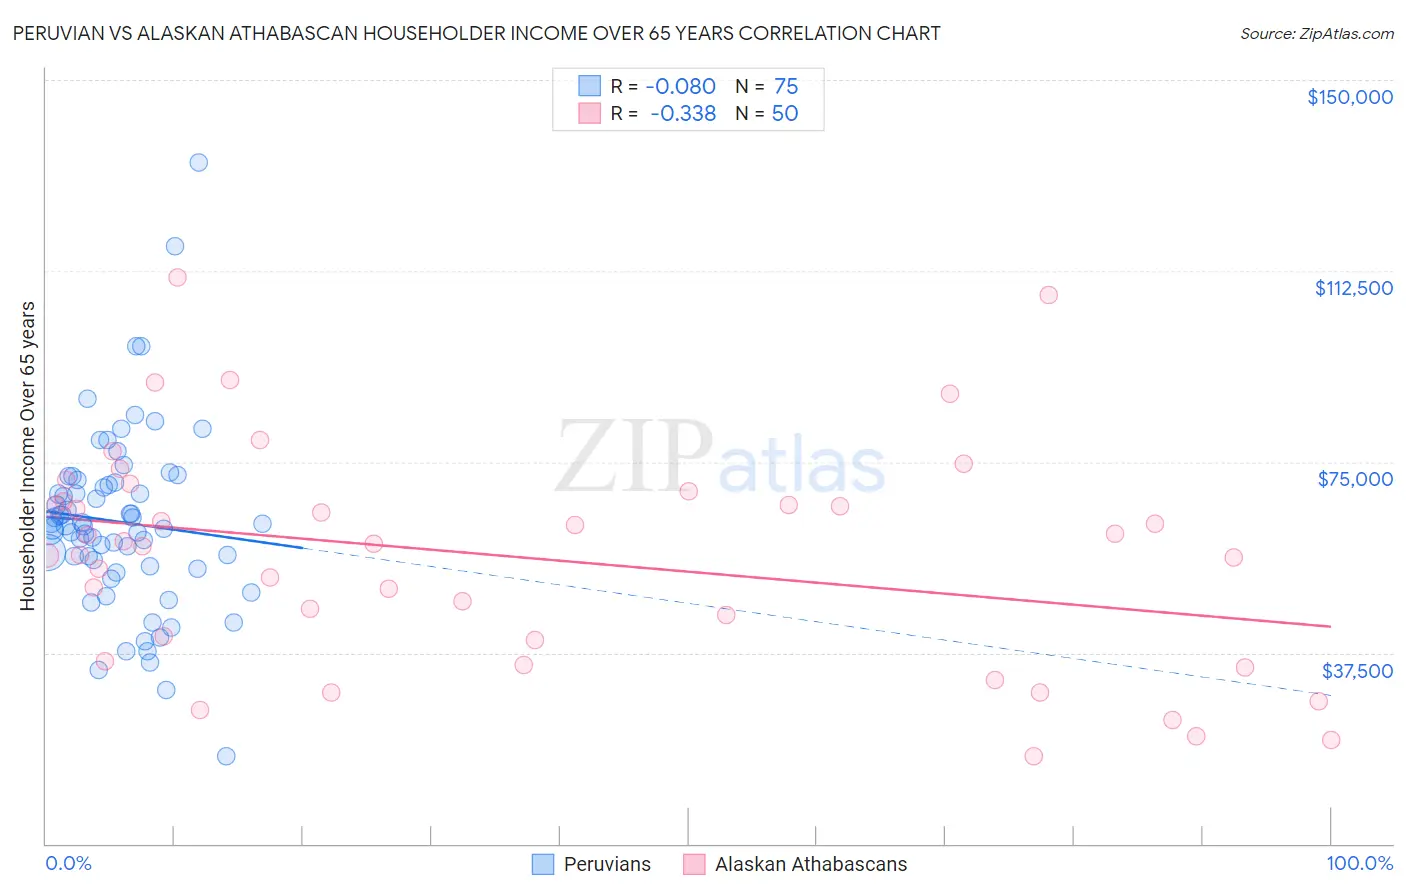
Peruvian vs Alaskan Athabascan Householder Income Over 65 years Correlation Chart
The statistical analysis conducted on geographies consisting of 361,900,663 people shows a slight negative correlation between the proportion of Peruvians and household income with householder over the age of 65 in the United States with a correlation coefficient (R) of -0.080 and weighted average of $62,766. Similarly, the statistical analysis conducted on geographies consisting of 45,769,893 people shows a mild negative correlation between the proportion of Alaskan Athabascans and household income with householder over the age of 65 in the United States with a correlation coefficient (R) of -0.338 and weighted average of $62,330, a difference of 0.70%.
Householder Income Over 65 years Correlation Summary
| Measurement | Peruvian | Alaskan Athabascan |
| Minimum | $17,083 | $17,188 |
| Maximum | $133,750 | $111,125 |
| Range | $116,667 | $93,937 |
| Mean | $63,177 | $56,372 |
| Median | $62,351 | $58,696 |
| Interquartile 25% (IQ1) | $54,608 | $40,000 |
| Interquartile 75% (IQ3) | $70,924 | $67,202 |
| Interquartile Range (IQR) | $16,316 | $27,202 |
| Standard Deviation (Sample) | $17,972 | $21,725 |
| Standard Deviation (Population) | $17,852 | $21,506 |
Demographics Similar to Peruvians and Alaskan Athabascans by Householder Income Over 65 years
In terms of householder income over 65 years, the demographic groups most similar to Peruvians are Swedish ($62,736, a difference of 0.050%), Aleut ($62,708, a difference of 0.090%), Immigrants from Eastern Europe ($62,693, a difference of 0.12%), Soviet Union ($62,848, a difference of 0.13%), and Basque ($62,653, a difference of 0.18%). Similarly, the demographic groups most similar to Alaskan Athabascans are Immigrants from Chile ($62,354, a difference of 0.040%), Immigrants from Syria ($62,303, a difference of 0.040%), Immigrants from Brazil ($62,364, a difference of 0.060%), Immigrants from Kazakhstan ($62,292, a difference of 0.060%), and Lebanese ($62,287, a difference of 0.070%).
| Demographics | Rating | Rank | Householder Income Over 65 years |
| Immigrants | Vietnam | 89.5 /100 | #121 | Excellent $63,014 |
| Immigrants | Moldova | 88.7 /100 | #122 | Excellent $62,939 |
| Tlingit-Haida | 88.6 /100 | #123 | Excellent $62,922 |
| Taiwanese | 88.3 /100 | #124 | Excellent $62,894 |
| Soviet Union | 87.8 /100 | #125 | Excellent $62,848 |
| Peruvians | 86.8 /100 | #126 | Excellent $62,766 |
| Swedes | 86.4 /100 | #127 | Excellent $62,736 |
| Aleuts | 86.1 /100 | #128 | Excellent $62,708 |
| Immigrants | Eastern Europe | 85.9 /100 | #129 | Excellent $62,693 |
| Basques | 85.4 /100 | #130 | Excellent $62,653 |
| Immigrants | Western Asia | 85.3 /100 | #131 | Excellent $62,645 |
| Immigrants | Germany | 83.9 /100 | #132 | Excellent $62,544 |
| Immigrants | Northern Africa | 83.6 /100 | #133 | Excellent $62,522 |
| Immigrants | Brazil | 81.2 /100 | #134 | Excellent $62,364 |
| Immigrants | Chile | 81.0 /100 | #135 | Excellent $62,354 |
| Alaskan Athabascans | 80.6 /100 | #136 | Excellent $62,330 |
| Immigrants | Syria | 80.2 /100 | #137 | Excellent $62,303 |
| Immigrants | Kazakhstan | 80.0 /100 | #138 | Excellent $62,292 |
| Lebanese | 79.9 /100 | #139 | Good $62,287 |
| Arabs | 79.6 /100 | #140 | Good $62,266 |
| Canadians | 79.0 /100 | #141 | Good $62,230 |