Peruvian vs Estonian Householder Income Ages 45 - 64 years
COMPARE
Peruvian
Estonian
Householder Income Ages 45 - 64 years
Householder Income Ages 45 - 64 years Comparison
Peruvians
Estonians
$105,070
HOUSEHOLDER INCOME AGES 45 - 64 YEARS
91.5/ 100
METRIC RATING
129th/ 347
METRIC RANK
$114,220
HOUSEHOLDER INCOME AGES 45 - 64 YEARS
99.9/ 100
METRIC RATING
42nd/ 347
METRIC RANK
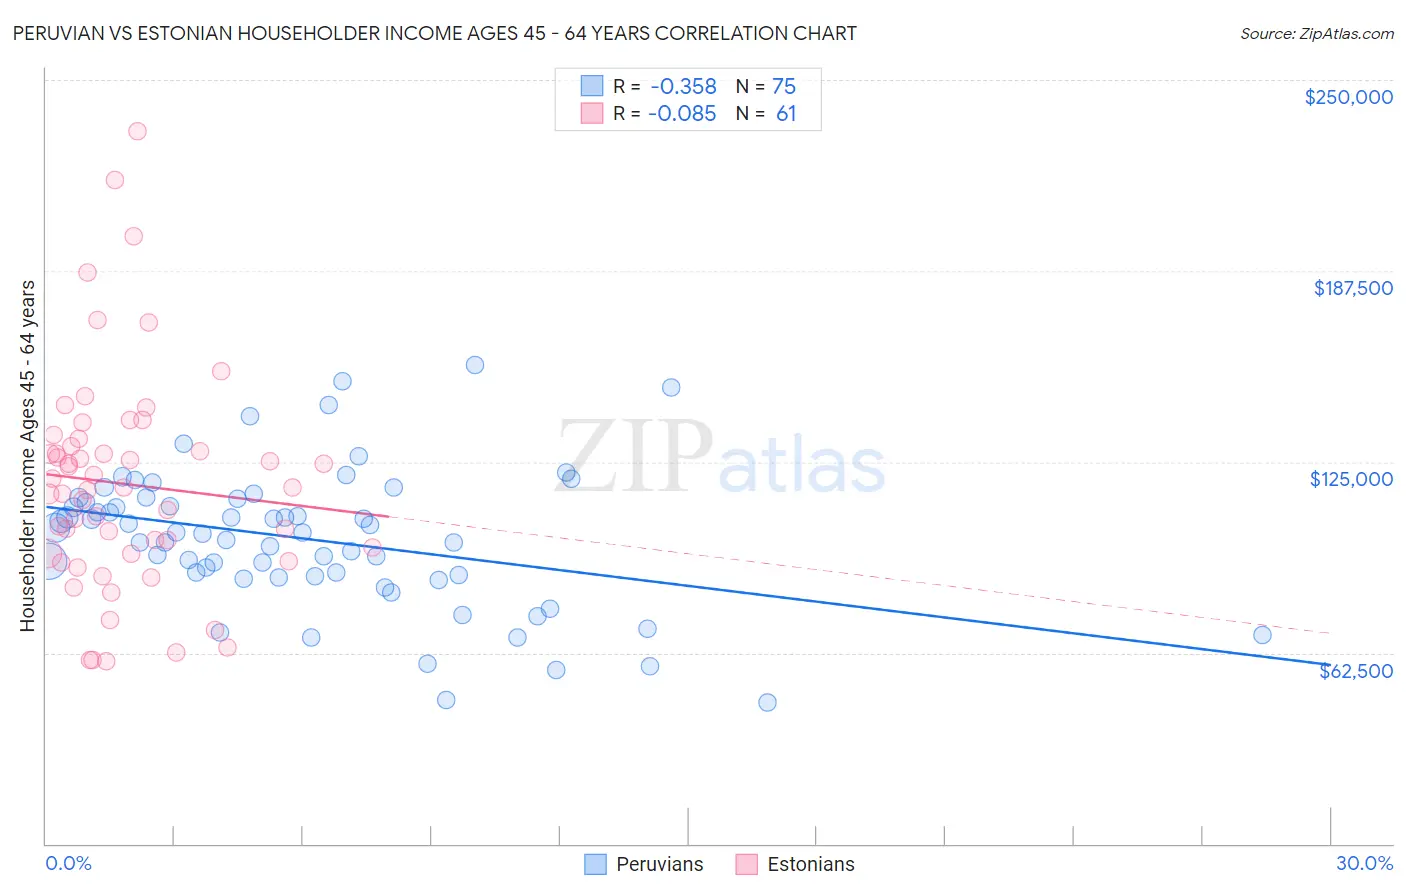
Peruvian vs Estonian Householder Income Ages 45 - 64 years Correlation Chart
The statistical analysis conducted on geographies consisting of 362,640,242 people shows a mild negative correlation between the proportion of Peruvians and household income with householder between the ages 45 and 64 in the United States with a correlation coefficient (R) of -0.358 and weighted average of $105,070. Similarly, the statistical analysis conducted on geographies consisting of 123,417,015 people shows a slight negative correlation between the proportion of Estonians and household income with householder between the ages 45 and 64 in the United States with a correlation coefficient (R) of -0.085 and weighted average of $114,220, a difference of 8.7%.
Householder Income Ages 45 - 64 years Correlation Summary
| Measurement | Peruvian | Estonian |
| Minimum | $46,375 | $59,757 |
| Maximum | $156,818 | $233,125 |
| Range | $110,443 | $173,368 |
| Mean | $99,765 | $117,742 |
| Median | $101,930 | $116,447 |
| Interquartile 25% (IQ1) | $87,436 | $95,098 |
| Interquartile 75% (IQ3) | $112,777 | $131,358 |
| Interquartile Range (IQR) | $25,341 | $36,260 |
| Standard Deviation (Sample) | $22,661 | $35,676 |
| Standard Deviation (Population) | $22,510 | $35,383 |
Similar Demographics by Householder Income Ages 45 - 64 years
Demographics Similar to Peruvians by Householder Income Ages 45 - 64 years
In terms of householder income ages 45 - 64 years, the demographic groups most similar to Peruvians are Immigrants from Zimbabwe ($104,992, a difference of 0.070%), Native Hawaiian ($105,149, a difference of 0.080%), Immigrants from Saudi Arabia ($105,249, a difference of 0.17%), Immigrants from Syria ($104,858, a difference of 0.20%), and Pakistani ($105,317, a difference of 0.23%).
| Demographics | Rating | Rank | Householder Income Ages 45 - 64 years |
| Immigrants | North Macedonia | 94.2 /100 | #122 | Exceptional $105,892 |
| Danes | 93.4 /100 | #123 | Exceptional $105,619 |
| Immigrants | Northern Africa | 92.8 /100 | #124 | Exceptional $105,430 |
| Pakistanis | 92.4 /100 | #125 | Exceptional $105,317 |
| Portuguese | 92.4 /100 | #126 | Exceptional $105,309 |
| Immigrants | Saudi Arabia | 92.2 /100 | #127 | Exceptional $105,249 |
| Native Hawaiians | 91.8 /100 | #128 | Exceptional $105,149 |
| Peruvians | 91.5 /100 | #129 | Exceptional $105,070 |
| Immigrants | Zimbabwe | 91.2 /100 | #130 | Exceptional $104,992 |
| Immigrants | Syria | 90.7 /100 | #131 | Exceptional $104,858 |
| Lebanese | 90.1 /100 | #132 | Exceptional $104,734 |
| Arabs | 89.3 /100 | #133 | Excellent $104,566 |
| Canadians | 89.3 /100 | #134 | Excellent $104,560 |
| Brazilians | 88.6 /100 | #135 | Excellent $104,408 |
| Taiwanese | 87.4 /100 | #136 | Excellent $104,180 |
Demographics Similar to Estonians by Householder Income Ages 45 - 64 years
In terms of householder income ages 45 - 64 years, the demographic groups most similar to Estonians are Israeli ($114,186, a difference of 0.030%), Immigrants from Lithuania ($114,336, a difference of 0.10%), Cambodian ($114,342, a difference of 0.11%), Immigrants from Turkey ($114,407, a difference of 0.16%), and Immigrants from Pakistan ($114,434, a difference of 0.19%).
| Demographics | Rating | Rank | Householder Income Ages 45 - 64 years |
| Latvians | 100.0 /100 | #35 | Exceptional $115,957 |
| Immigrants | Switzerland | 100.0 /100 | #36 | Exceptional $115,934 |
| Maltese | 99.9 /100 | #37 | Exceptional $114,754 |
| Immigrants | Pakistan | 99.9 /100 | #38 | Exceptional $114,434 |
| Immigrants | Turkey | 99.9 /100 | #39 | Exceptional $114,407 |
| Cambodians | 99.9 /100 | #40 | Exceptional $114,342 |
| Immigrants | Lithuania | 99.9 /100 | #41 | Exceptional $114,336 |
| Estonians | 99.9 /100 | #42 | Exceptional $114,220 |
| Israelis | 99.9 /100 | #43 | Exceptional $114,186 |
| Bulgarians | 99.9 /100 | #44 | Exceptional $113,883 |
| Immigrants | France | 99.9 /100 | #45 | Exceptional $113,680 |
| Immigrants | Greece | 99.9 /100 | #46 | Exceptional $113,548 |
| Australians | 99.9 /100 | #47 | Exceptional $113,533 |
| Immigrants | Indonesia | 99.9 /100 | #48 | Exceptional $113,519 |
| Immigrants | Russia | 99.8 /100 | #49 | Exceptional $113,215 |