Panamanian vs Immigrants from St. Vincent and the Grenadines Per Capita Income
COMPARE
Panamanian
Immigrants from St. Vincent and the Grenadines
Per Capita Income
Per Capita Income Comparison
Panamanians
Immigrants from St. Vincent and the Grenadines
$42,035
PER CAPITA INCOME
13.9/ 100
METRIC RATING
208th/ 347
METRIC RANK
$41,270
PER CAPITA INCOME
6.4/ 100
METRIC RATING
224th/ 347
METRIC RANK
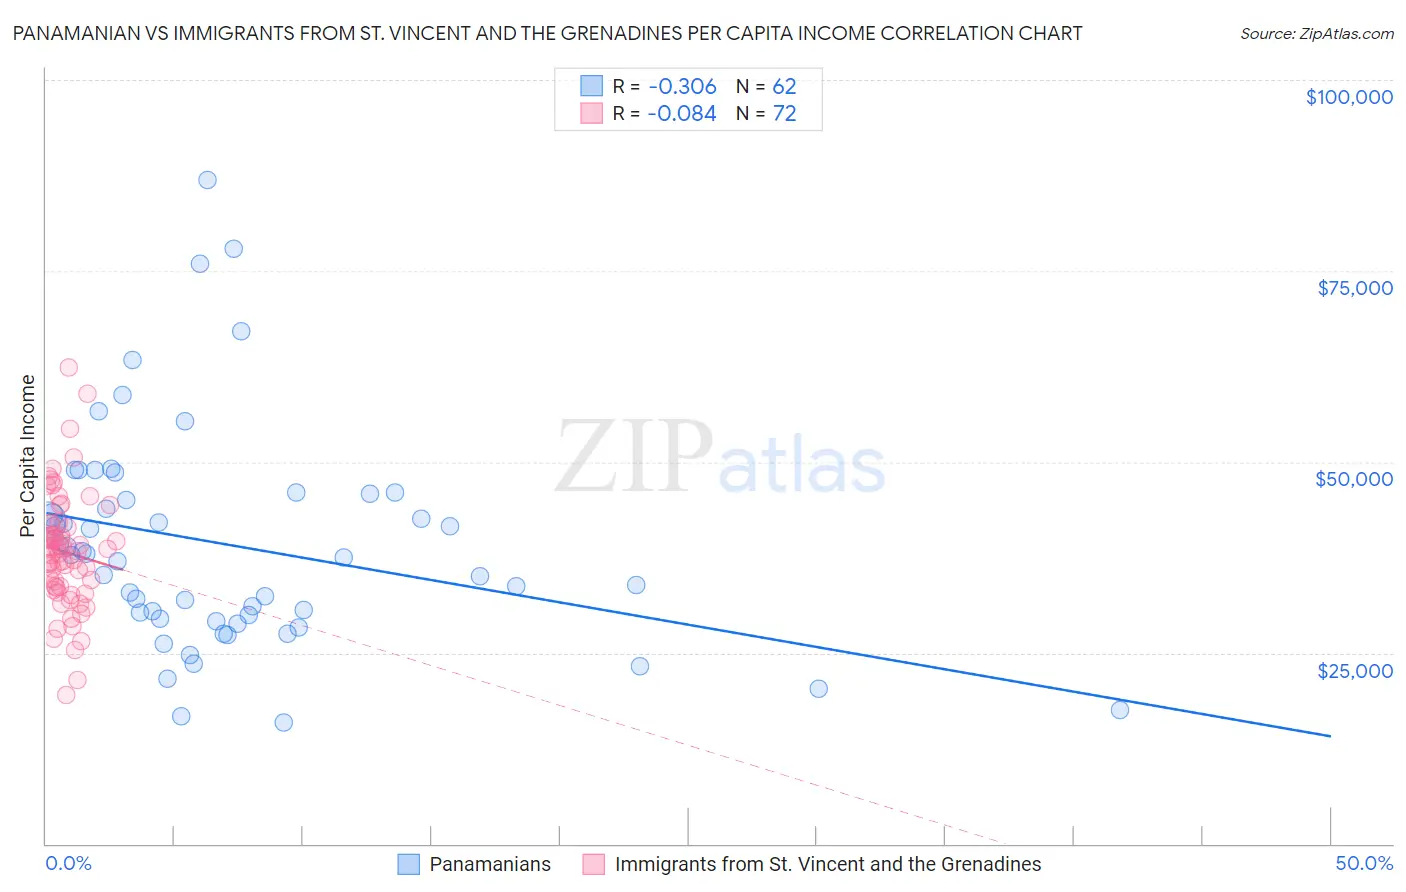
Panamanian vs Immigrants from St. Vincent and the Grenadines Per Capita Income Correlation Chart
The statistical analysis conducted on geographies consisting of 281,258,630 people shows a mild negative correlation between the proportion of Panamanians and per capita income in the United States with a correlation coefficient (R) of -0.306 and weighted average of $42,035. Similarly, the statistical analysis conducted on geographies consisting of 56,193,038 people shows a slight negative correlation between the proportion of Immigrants from St. Vincent and the Grenadines and per capita income in the United States with a correlation coefficient (R) of -0.084 and weighted average of $41,270, a difference of 1.8%.
Per Capita Income Correlation Summary
| Measurement | Panamanian | Immigrants from St. Vincent and the Grenadines |
| Minimum | $15,844 | $19,537 |
| Maximum | $86,907 | $62,321 |
| Range | $71,063 | $42,784 |
| Mean | $39,085 | $38,234 |
| Median | $37,643 | $38,416 |
| Interquartile 25% (IQ1) | $29,415 | $33,608 |
| Interquartile 75% (IQ3) | $45,746 | $41,632 |
| Interquartile Range (IQR) | $16,331 | $8,024 |
| Standard Deviation (Sample) | $14,450 | $7,601 |
| Standard Deviation (Population) | $14,333 | $7,548 |
Demographics Similar to Panamanians and Immigrants from St. Vincent and the Grenadines by Per Capita Income
In terms of per capita income, the demographic groups most similar to Panamanians are Venezuelan ($42,074, a difference of 0.090%), Immigrants from Sudan ($41,986, a difference of 0.12%), Ecuadorian ($41,958, a difference of 0.18%), Ghanaian ($42,164, a difference of 0.31%), and Immigrants from Panama ($41,853, a difference of 0.43%). Similarly, the demographic groups most similar to Immigrants from St. Vincent and the Grenadines are West Indian ($41,217, a difference of 0.13%), Immigrants from Cameroon ($41,334, a difference of 0.16%), Immigrants from Ecuador ($41,195, a difference of 0.18%), Immigrants from Iraq ($41,365, a difference of 0.23%), and Immigrants from Barbados ($41,478, a difference of 0.50%).
| Demographics | Rating | Rank | Per Capita Income |
| Ghanaians | 15.7 /100 | #206 | Poor $42,164 |
| Venezuelans | 14.4 /100 | #207 | Poor $42,074 |
| Panamanians | 13.9 /100 | #208 | Poor $42,035 |
| Immigrants | Sudan | 13.2 /100 | #209 | Poor $41,986 |
| Ecuadorians | 12.9 /100 | #210 | Poor $41,958 |
| Immigrants | Panama | 11.6 /100 | #211 | Poor $41,853 |
| Immigrants | Senegal | 11.3 /100 | #212 | Poor $41,830 |
| Immigrants | Venezuela | 10.2 /100 | #213 | Poor $41,727 |
| Immigrants | Bangladesh | 10.1 /100 | #214 | Poor $41,709 |
| Sudanese | 9.9 /100 | #215 | Tragic $41,695 |
| Tongans | 9.9 /100 | #216 | Tragic $41,693 |
| Guamanians/Chamorros | 9.7 /100 | #217 | Tragic $41,678 |
| Trinidadians and Tobagonians | 9.5 /100 | #218 | Tragic $41,655 |
| Puget Sound Salish | 8.1 /100 | #219 | Tragic $41,495 |
| Immigrants | Barbados | 7.9 /100 | #220 | Tragic $41,478 |
| Immigrants | Trinidad and Tobago | 7.9 /100 | #221 | Tragic $41,476 |
| Immigrants | Iraq | 7.1 /100 | #222 | Tragic $41,365 |
| Immigrants | Cameroon | 6.8 /100 | #223 | Tragic $41,334 |
| Immigrants | St. Vincent and the Grenadines | 6.4 /100 | #224 | Tragic $41,270 |
| West Indians | 6.0 /100 | #225 | Tragic $41,217 |
| Immigrants | Ecuador | 5.9 /100 | #226 | Tragic $41,195 |