Immigrants from Latin America vs Immigrants from Albania Median Earnings
COMPARE
Immigrants from Latin America
Immigrants from Albania
Median Earnings
Median Earnings Comparison
Immigrants from Latin America
Immigrants from Albania
$41,049
MEDIAN EARNINGS
0.1/ 100
METRIC RATING
301st/ 347
METRIC RANK
$49,377
MEDIAN EARNINGS
98.4/ 100
METRIC RATING
106th/ 347
METRIC RANK
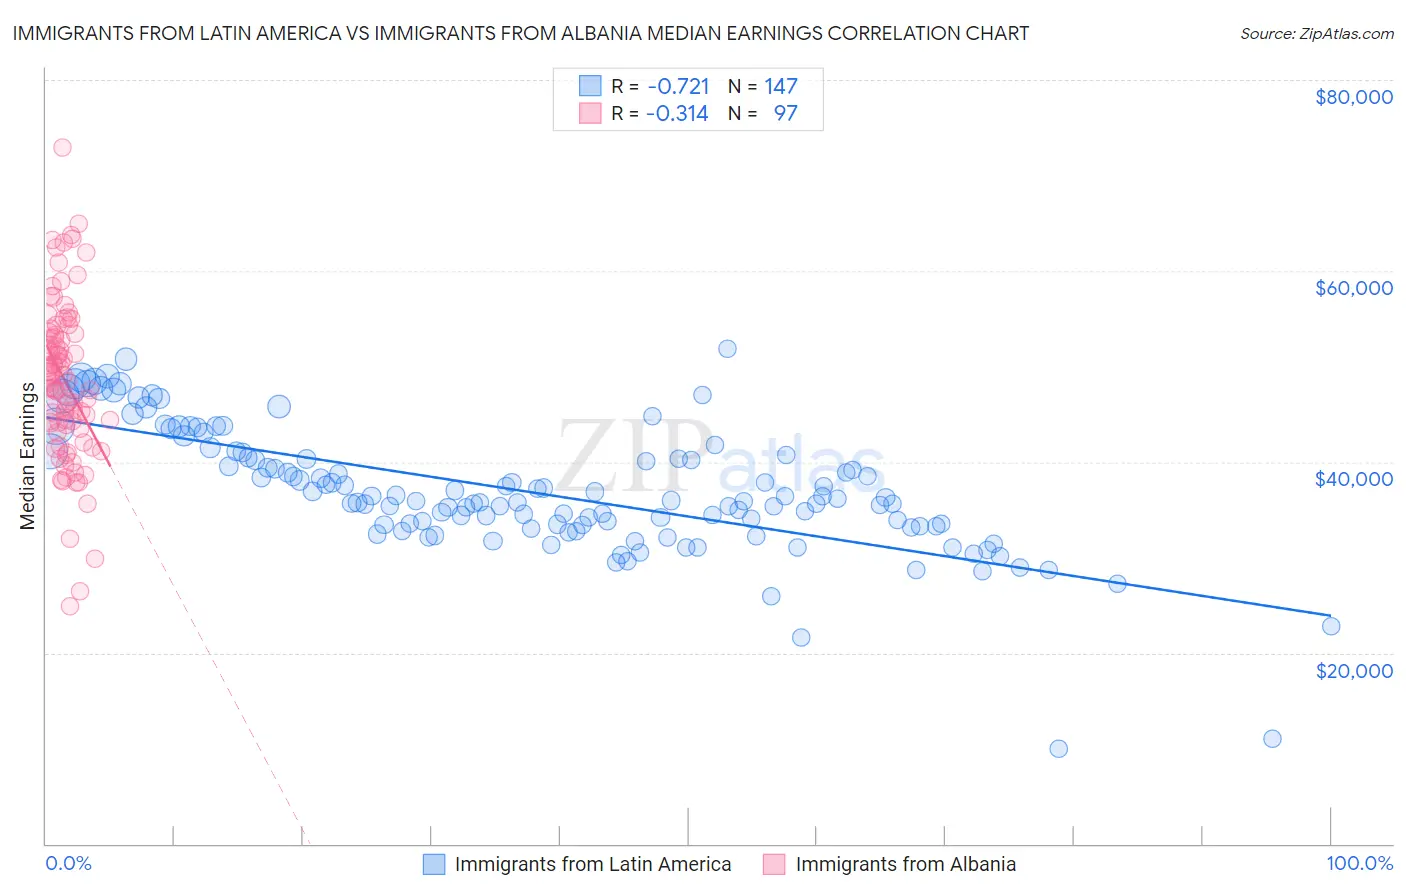
Immigrants from Latin America vs Immigrants from Albania Median Earnings Correlation Chart
The statistical analysis conducted on geographies consisting of 558,378,715 people shows a strong negative correlation between the proportion of Immigrants from Latin America and median earnings in the United States with a correlation coefficient (R) of -0.721 and weighted average of $41,049. Similarly, the statistical analysis conducted on geographies consisting of 119,374,526 people shows a mild negative correlation between the proportion of Immigrants from Albania and median earnings in the United States with a correlation coefficient (R) of -0.314 and weighted average of $49,377, a difference of 20.3%.
Median Earnings Correlation Summary
| Measurement | Immigrants from Latin America | Immigrants from Albania |
| Minimum | $9,917 | $24,914 |
| Maximum | $51,911 | $72,899 |
| Range | $41,994 | $47,985 |
| Mean | $36,860 | $48,556 |
| Median | $35,939 | $49,058 |
| Interquartile 25% (IQ1) | $33,290 | $43,717 |
| Interquartile 75% (IQ3) | $40,442 | $53,495 |
| Interquartile Range (IQR) | $7,152 | $9,778 |
| Standard Deviation (Sample) | $6,579 | $8,407 |
| Standard Deviation (Population) | $6,556 | $8,364 |
Similar Demographics by Median Earnings
Demographics Similar to Immigrants from Latin America by Median Earnings
In terms of median earnings, the demographic groups most similar to Immigrants from Latin America are Ute ($41,051, a difference of 0.010%), Immigrants from Caribbean ($41,119, a difference of 0.17%), Immigrants from Micronesia ($41,133, a difference of 0.20%), Shoshone ($40,932, a difference of 0.29%), and Haitian ($40,918, a difference of 0.32%).
| Demographics | Rating | Rank | Median Earnings |
| Potawatomi | 0.1 /100 | #294 | Tragic $41,288 |
| Bangladeshis | 0.1 /100 | #295 | Tragic $41,263 |
| Cherokee | 0.1 /100 | #296 | Tragic $41,252 |
| Guatemalans | 0.1 /100 | #297 | Tragic $41,205 |
| Immigrants | Micronesia | 0.1 /100 | #298 | Tragic $41,133 |
| Immigrants | Caribbean | 0.1 /100 | #299 | Tragic $41,119 |
| Ute | 0.1 /100 | #300 | Tragic $41,051 |
| Immigrants | Latin America | 0.1 /100 | #301 | Tragic $41,049 |
| Shoshone | 0.0 /100 | #302 | Tragic $40,932 |
| Haitians | 0.0 /100 | #303 | Tragic $40,918 |
| Immigrants | Guatemala | 0.0 /100 | #304 | Tragic $40,851 |
| Chickasaw | 0.0 /100 | #305 | Tragic $40,672 |
| Yaqui | 0.0 /100 | #306 | Tragic $40,647 |
| Hondurans | 0.0 /100 | #307 | Tragic $40,638 |
| Cubans | 0.0 /100 | #308 | Tragic $40,619 |
Demographics Similar to Immigrants from Albania by Median Earnings
In terms of median earnings, the demographic groups most similar to Immigrants from Albania are Immigrants from Western Asia ($49,389, a difference of 0.020%), Immigrants from Morocco ($49,368, a difference of 0.020%), Immigrants from Brazil ($49,463, a difference of 0.17%), Austrian ($49,501, a difference of 0.25%), and Palestinian ($49,209, a difference of 0.34%).
| Demographics | Rating | Rank | Median Earnings |
| Immigrants | Afghanistan | 98.9 /100 | #99 | Exceptional $49,645 |
| Immigrants | Poland | 98.9 /100 | #100 | Exceptional $49,633 |
| Jordanians | 98.9 /100 | #101 | Exceptional $49,632 |
| Ethiopians | 98.8 /100 | #102 | Exceptional $49,572 |
| Austrians | 98.7 /100 | #103 | Exceptional $49,501 |
| Immigrants | Brazil | 98.6 /100 | #104 | Exceptional $49,463 |
| Immigrants | Western Asia | 98.4 /100 | #105 | Exceptional $49,389 |
| Immigrants | Albania | 98.4 /100 | #106 | Exceptional $49,377 |
| Immigrants | Morocco | 98.4 /100 | #107 | Exceptional $49,368 |
| Palestinians | 98.0 /100 | #108 | Exceptional $49,209 |
| Syrians | 97.1 /100 | #109 | Exceptional $48,934 |
| Immigrants | Ethiopia | 97.1 /100 | #110 | Exceptional $48,924 |
| Immigrants | Zimbabwe | 97.0 /100 | #111 | Exceptional $48,913 |
| Northern Europeans | 96.9 /100 | #112 | Exceptional $48,887 |
| Immigrants | Kuwait | 96.8 /100 | #113 | Exceptional $48,861 |