Immigrants from Syria vs Immigrants from Albania Median Earnings
COMPARE
Immigrants from Syria
Immigrants from Albania
Median Earnings
Median Earnings Comparison
Immigrants from Syria
Immigrants from Albania
$48,375
MEDIAN EARNINGS
93.9/ 100
METRIC RATING
123rd/ 347
METRIC RANK
$49,377
MEDIAN EARNINGS
98.4/ 100
METRIC RATING
106th/ 347
METRIC RANK
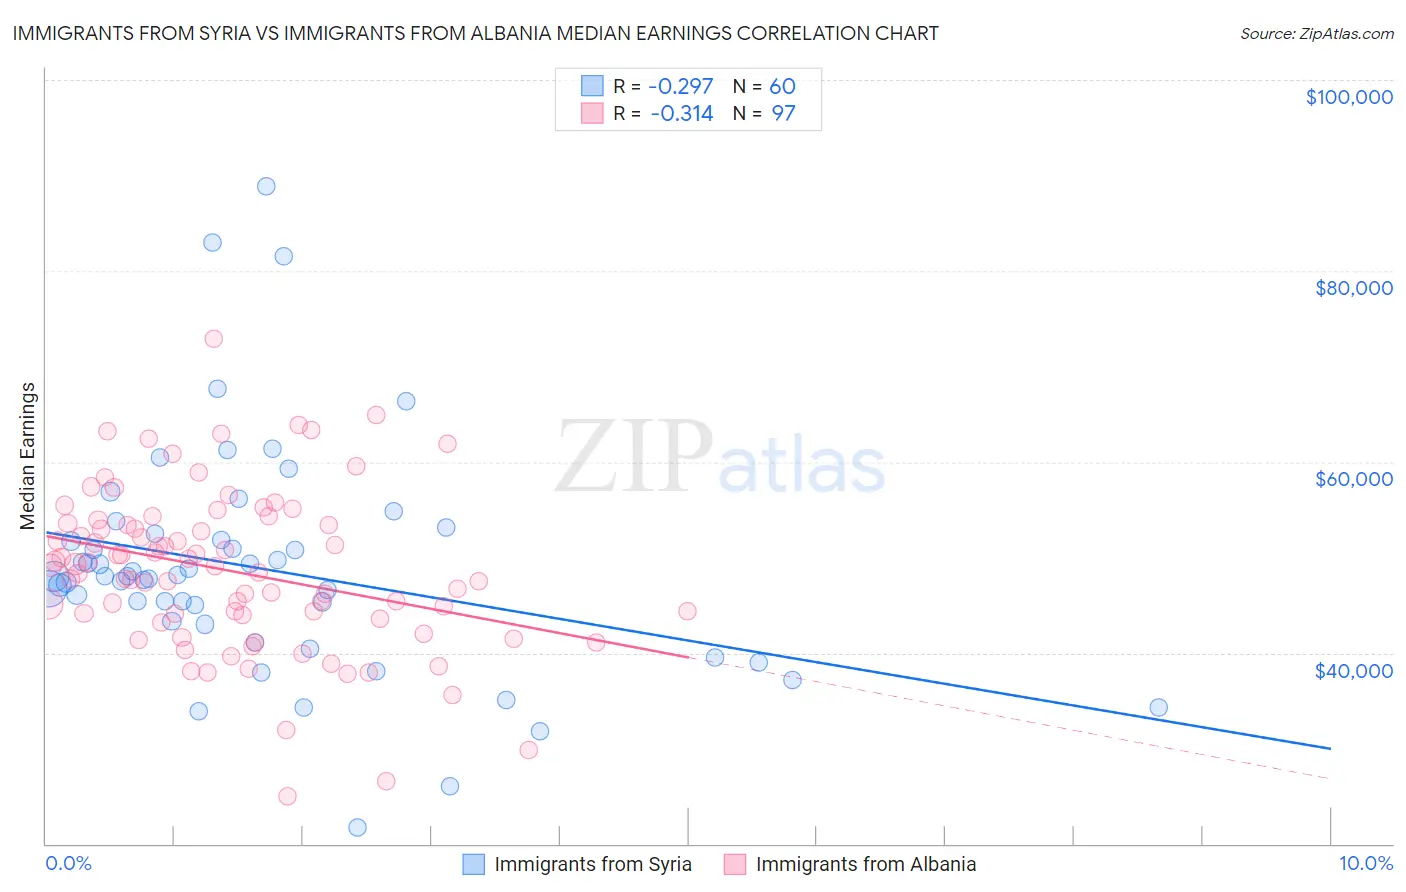
Immigrants from Syria vs Immigrants from Albania Median Earnings Correlation Chart
The statistical analysis conducted on geographies consisting of 174,102,272 people shows a weak negative correlation between the proportion of Immigrants from Syria and median earnings in the United States with a correlation coefficient (R) of -0.297 and weighted average of $48,375. Similarly, the statistical analysis conducted on geographies consisting of 119,374,526 people shows a mild negative correlation between the proportion of Immigrants from Albania and median earnings in the United States with a correlation coefficient (R) of -0.314 and weighted average of $49,377, a difference of 2.1%.
Median Earnings Correlation Summary
| Measurement | Immigrants from Syria | Immigrants from Albania |
| Minimum | $21,696 | $24,914 |
| Maximum | $88,902 | $72,899 |
| Range | $67,206 | $47,985 |
| Mean | $48,829 | $48,556 |
| Median | $48,019 | $49,058 |
| Interquartile 25% (IQ1) | $43,163 | $43,717 |
| Interquartile 75% (IQ3) | $52,131 | $53,495 |
| Interquartile Range (IQR) | $8,968 | $9,778 |
| Standard Deviation (Sample) | $12,024 | $8,407 |
| Standard Deviation (Population) | $11,923 | $8,364 |
Demographics Similar to Immigrants from Syria and Immigrants from Albania by Median Earnings
In terms of median earnings, the demographic groups most similar to Immigrants from Syria are Brazilian ($48,356, a difference of 0.040%), Chilean ($48,504, a difference of 0.27%), Arab ($48,599, a difference of 0.46%), Carpatho Rusyn ($48,617, a difference of 0.50%), and Polish ($48,659, a difference of 0.59%). Similarly, the demographic groups most similar to Immigrants from Albania are Immigrants from Western Asia ($49,389, a difference of 0.020%), Immigrants from Morocco ($49,368, a difference of 0.020%), Immigrants from Brazil ($49,463, a difference of 0.17%), Palestinian ($49,209, a difference of 0.34%), and Syrian ($48,934, a difference of 0.91%).
| Demographics | Rating | Rank | Median Earnings |
| Immigrants | Brazil | 98.6 /100 | #104 | Exceptional $49,463 |
| Immigrants | Western Asia | 98.4 /100 | #105 | Exceptional $49,389 |
| Immigrants | Albania | 98.4 /100 | #106 | Exceptional $49,377 |
| Immigrants | Morocco | 98.4 /100 | #107 | Exceptional $49,368 |
| Palestinians | 98.0 /100 | #108 | Exceptional $49,209 |
| Syrians | 97.1 /100 | #109 | Exceptional $48,934 |
| Immigrants | Ethiopia | 97.1 /100 | #110 | Exceptional $48,924 |
| Immigrants | Zimbabwe | 97.0 /100 | #111 | Exceptional $48,913 |
| Northern Europeans | 96.9 /100 | #112 | Exceptional $48,887 |
| Immigrants | Kuwait | 96.8 /100 | #113 | Exceptional $48,861 |
| Moroccans | 96.7 /100 | #114 | Exceptional $48,838 |
| Chinese | 96.7 /100 | #115 | Exceptional $48,836 |
| Koreans | 96.2 /100 | #116 | Exceptional $48,727 |
| Serbians | 95.9 /100 | #117 | Exceptional $48,677 |
| Immigrants | Jordan | 95.9 /100 | #118 | Exceptional $48,673 |
| Poles | 95.8 /100 | #119 | Exceptional $48,659 |
| Carpatho Rusyns | 95.5 /100 | #120 | Exceptional $48,617 |
| Arabs | 95.4 /100 | #121 | Exceptional $48,599 |
| Chileans | 94.8 /100 | #122 | Exceptional $48,504 |
| Immigrants | Syria | 93.9 /100 | #123 | Exceptional $48,375 |
| Brazilians | 93.7 /100 | #124 | Exceptional $48,356 |