Paiute vs Lumbee Median Female Earnings
COMPARE
Paiute
Lumbee
Median Female Earnings
Median Female Earnings Comparison
Paiute
Lumbee
$36,056
MEDIAN FEMALE EARNINGS
0.1/ 100
METRIC RATING
285th/ 347
METRIC RANK
$32,500
MEDIAN FEMALE EARNINGS
0.0/ 100
METRIC RATING
344th/ 347
METRIC RANK
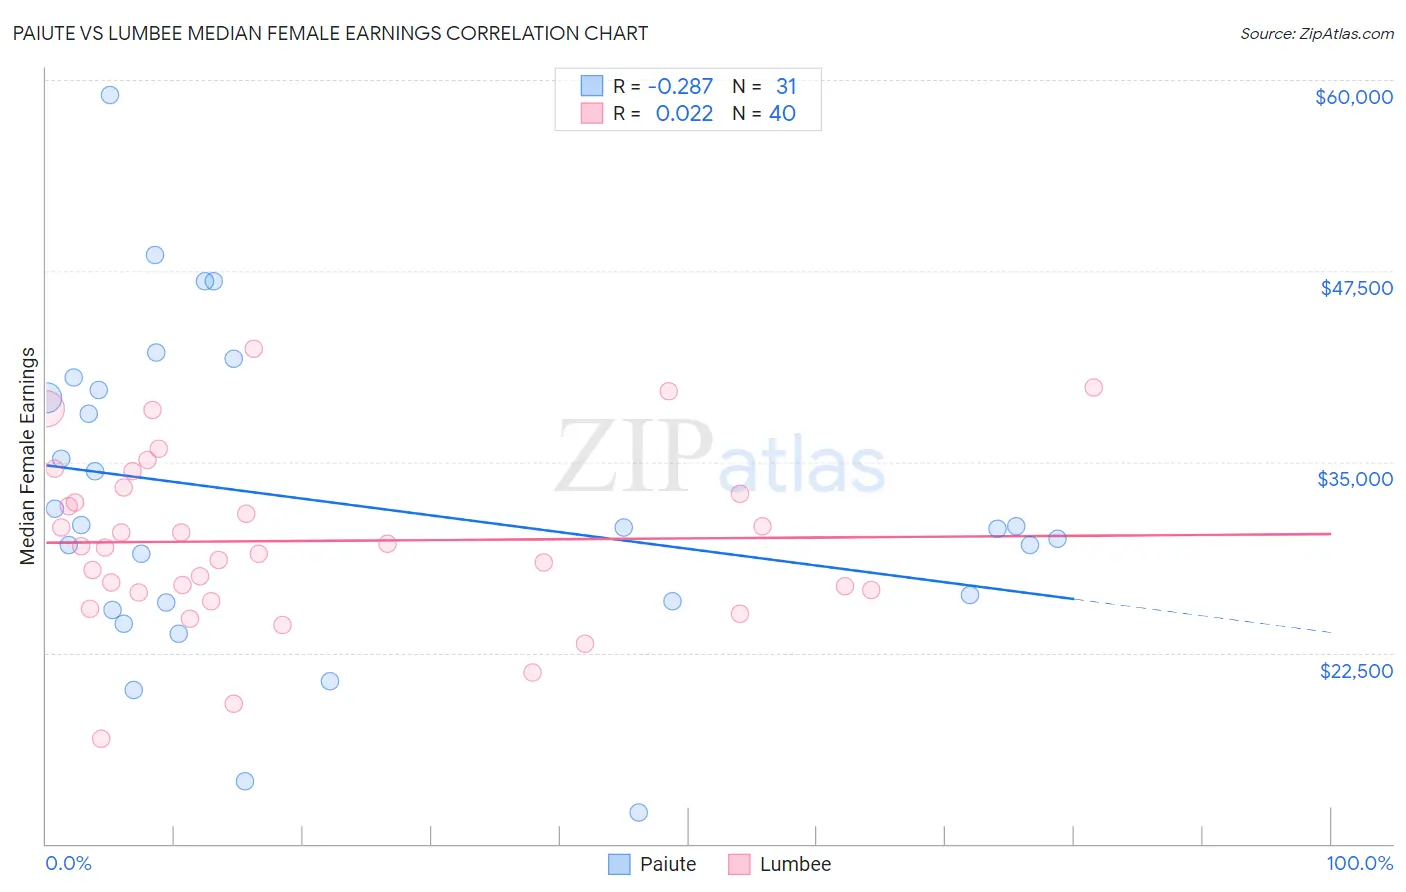
Paiute vs Lumbee Median Female Earnings Correlation Chart
The statistical analysis conducted on geographies consisting of 58,379,978 people shows a weak negative correlation between the proportion of Paiute and median female earnings in the United States with a correlation coefficient (R) of -0.287 and weighted average of $36,056. Similarly, the statistical analysis conducted on geographies consisting of 92,259,660 people shows no correlation between the proportion of Lumbee and median female earnings in the United States with a correlation coefficient (R) of 0.022 and weighted average of $32,500, a difference of 10.9%.
Median Female Earnings Correlation Summary
| Measurement | Paiute | Lumbee |
| Minimum | $12,045 | $16,874 |
| Maximum | $59,011 | $42,434 |
| Range | $46,966 | $25,560 |
| Mean | $32,370 | $29,823 |
| Median | $30,682 | $29,442 |
| Interquartile 25% (IQ1) | $25,816 | $26,496 |
| Interquartile 75% (IQ3) | $39,733 | $33,125 |
| Interquartile Range (IQR) | $13,917 | $6,629 |
| Standard Deviation (Sample) | $10,286 | $5,605 |
| Standard Deviation (Population) | $10,119 | $5,534 |
Similar Demographics by Median Female Earnings
Demographics Similar to Paiute by Median Female Earnings
In terms of median female earnings, the demographic groups most similar to Paiute are Osage ($36,034, a difference of 0.060%), Immigrants from Nicaragua ($36,023, a difference of 0.090%), Immigrants from Zaire ($36,017, a difference of 0.11%), Indonesian ($36,140, a difference of 0.23%), and Bangladeshi ($35,960, a difference of 0.27%).
| Demographics | Rating | Rank | Median Female Earnings |
| U.S. Virgin Islanders | 0.1 /100 | #278 | Tragic $36,424 |
| Immigrants | Caribbean | 0.1 /100 | #279 | Tragic $36,414 |
| Iroquois | 0.1 /100 | #280 | Tragic $36,408 |
| Spanish Americans | 0.1 /100 | #281 | Tragic $36,391 |
| Haitians | 0.1 /100 | #282 | Tragic $36,374 |
| Immigrants | Haiti | 0.1 /100 | #283 | Tragic $36,203 |
| Indonesians | 0.1 /100 | #284 | Tragic $36,140 |
| Paiute | 0.1 /100 | #285 | Tragic $36,056 |
| Osage | 0.0 /100 | #286 | Tragic $36,034 |
| Immigrants | Nicaragua | 0.0 /100 | #287 | Tragic $36,023 |
| Immigrants | Zaire | 0.0 /100 | #288 | Tragic $36,017 |
| Bangladeshis | 0.0 /100 | #289 | Tragic $35,960 |
| Central American Indians | 0.0 /100 | #290 | Tragic $35,930 |
| Blackfeet | 0.0 /100 | #291 | Tragic $35,864 |
| Americans | 0.0 /100 | #292 | Tragic $35,777 |
Demographics Similar to Lumbee by Median Female Earnings
In terms of median female earnings, the demographic groups most similar to Lumbee are Pueblo ($32,564, a difference of 0.20%), Yup'ik ($32,730, a difference of 0.71%), Navajo ($33,046, a difference of 1.7%), Tohono O'odham ($33,205, a difference of 2.2%), and Immigrants from Mexico ($33,236, a difference of 2.3%).
| Demographics | Rating | Rank | Median Female Earnings |
| Mexicans | 0.0 /100 | #333 | Tragic $33,664 |
| Spanish American Indians | 0.0 /100 | #334 | Tragic $33,625 |
| Creek | 0.0 /100 | #335 | Tragic $33,437 |
| Ottawa | 0.0 /100 | #336 | Tragic $33,378 |
| Yakama | 0.0 /100 | #337 | Tragic $33,354 |
| Immigrants | Cuba | 0.0 /100 | #338 | Tragic $33,291 |
| Immigrants | Mexico | 0.0 /100 | #339 | Tragic $33,236 |
| Tohono O'odham | 0.0 /100 | #340 | Tragic $33,205 |
| Navajo | 0.0 /100 | #341 | Tragic $33,046 |
| Yup'ik | 0.0 /100 | #342 | Tragic $32,730 |
| Pueblo | 0.0 /100 | #343 | Tragic $32,564 |
| Lumbee | 0.0 /100 | #344 | Tragic $32,500 |
| Puerto Ricans | 0.0 /100 | #345 | Tragic $31,560 |
| Arapaho | 0.0 /100 | #346 | Tragic $31,489 |
| Houma | 0.0 /100 | #347 | Tragic $30,343 |