Paiute vs Slovene Median Female Earnings
COMPARE
Paiute
Slovene
Median Female Earnings
Median Female Earnings Comparison
Paiute
Slovenes
$36,056
MEDIAN FEMALE EARNINGS
0.1/ 100
METRIC RATING
285th/ 347
METRIC RANK
$39,817
MEDIAN FEMALE EARNINGS
56.2/ 100
METRIC RATING
170th/ 347
METRIC RANK
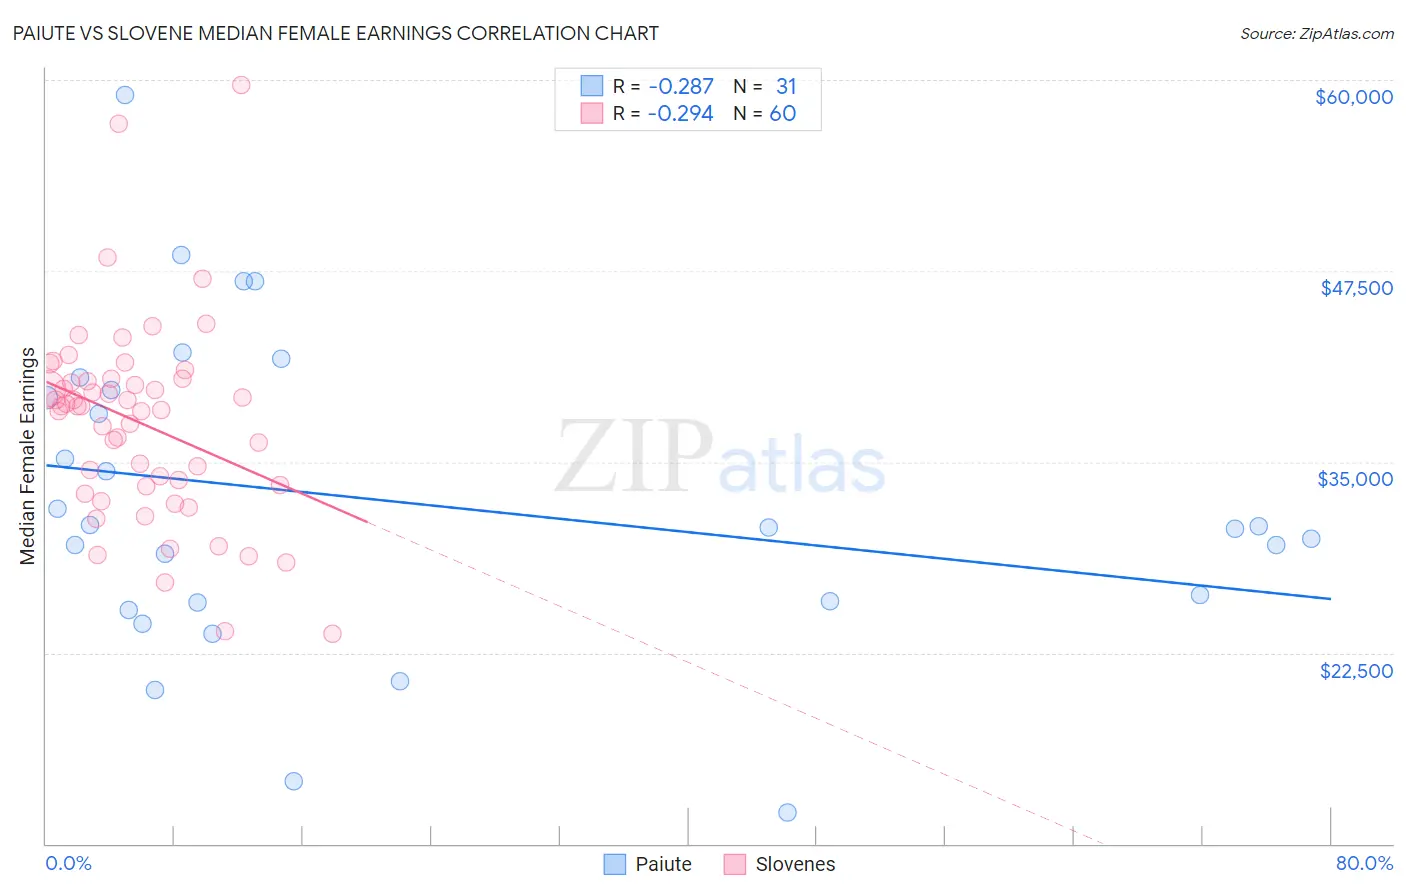
Paiute vs Slovene Median Female Earnings Correlation Chart
The statistical analysis conducted on geographies consisting of 58,379,978 people shows a weak negative correlation between the proportion of Paiute and median female earnings in the United States with a correlation coefficient (R) of -0.287 and weighted average of $36,056. Similarly, the statistical analysis conducted on geographies consisting of 261,275,001 people shows a weak negative correlation between the proportion of Slovenes and median female earnings in the United States with a correlation coefficient (R) of -0.294 and weighted average of $39,817, a difference of 10.4%.
Median Female Earnings Correlation Summary
| Measurement | Paiute | Slovene |
| Minimum | $12,045 | $23,750 |
| Maximum | $59,011 | $59,643 |
| Range | $46,966 | $35,893 |
| Mean | $32,370 | $37,579 |
| Median | $30,682 | $38,639 |
| Interquartile 25% (IQ1) | $25,816 | $33,473 |
| Interquartile 75% (IQ3) | $39,733 | $40,326 |
| Interquartile Range (IQR) | $13,917 | $6,853 |
| Standard Deviation (Sample) | $10,286 | $6,516 |
| Standard Deviation (Population) | $10,119 | $6,461 |
Similar Demographics by Median Female Earnings
Demographics Similar to Paiute by Median Female Earnings
In terms of median female earnings, the demographic groups most similar to Paiute are Osage ($36,034, a difference of 0.060%), Immigrants from Nicaragua ($36,023, a difference of 0.090%), Immigrants from Zaire ($36,017, a difference of 0.11%), Indonesian ($36,140, a difference of 0.23%), and Bangladeshi ($35,960, a difference of 0.27%).
| Demographics | Rating | Rank | Median Female Earnings |
| U.S. Virgin Islanders | 0.1 /100 | #278 | Tragic $36,424 |
| Immigrants | Caribbean | 0.1 /100 | #279 | Tragic $36,414 |
| Iroquois | 0.1 /100 | #280 | Tragic $36,408 |
| Spanish Americans | 0.1 /100 | #281 | Tragic $36,391 |
| Haitians | 0.1 /100 | #282 | Tragic $36,374 |
| Immigrants | Haiti | 0.1 /100 | #283 | Tragic $36,203 |
| Indonesians | 0.1 /100 | #284 | Tragic $36,140 |
| Paiute | 0.1 /100 | #285 | Tragic $36,056 |
| Osage | 0.0 /100 | #286 | Tragic $36,034 |
| Immigrants | Nicaragua | 0.0 /100 | #287 | Tragic $36,023 |
| Immigrants | Zaire | 0.0 /100 | #288 | Tragic $36,017 |
| Bangladeshis | 0.0 /100 | #289 | Tragic $35,960 |
| Central American Indians | 0.0 /100 | #290 | Tragic $35,930 |
| Blackfeet | 0.0 /100 | #291 | Tragic $35,864 |
| Americans | 0.0 /100 | #292 | Tragic $35,777 |
Demographics Similar to Slovenes by Median Female Earnings
In terms of median female earnings, the demographic groups most similar to Slovenes are Immigrants from Portugal ($39,788, a difference of 0.070%), Kenyan ($39,860, a difference of 0.11%), British ($39,772, a difference of 0.11%), Immigrants from Peru ($39,871, a difference of 0.13%), and Immigrants from Ghana ($39,894, a difference of 0.19%).
| Demographics | Rating | Rank | Median Female Earnings |
| Lebanese | 65.5 /100 | #163 | Good $40,006 |
| Immigrants | Saudi Arabia | 62.9 /100 | #164 | Good $39,952 |
| Immigrants | Bangladesh | 60.8 /100 | #165 | Good $39,910 |
| Immigrants | Ghana | 60.0 /100 | #166 | Good $39,894 |
| Luxembourgers | 59.9 /100 | #167 | Average $39,891 |
| Immigrants | Peru | 58.9 /100 | #168 | Average $39,871 |
| Kenyans | 58.4 /100 | #169 | Average $39,860 |
| Slovenes | 56.2 /100 | #170 | Average $39,817 |
| Immigrants | Portugal | 54.7 /100 | #171 | Average $39,788 |
| British | 53.8 /100 | #172 | Average $39,772 |
| Canadians | 51.4 /100 | #173 | Average $39,724 |
| South Americans | 50.0 /100 | #174 | Average $39,698 |
| Immigrants | South America | 47.2 /100 | #175 | Average $39,643 |
| Nigerians | 47.0 /100 | #176 | Average $39,641 |
| Costa Ricans | 46.1 /100 | #177 | Average $39,622 |