Paiute vs Immigrants from Moldova Householder Income Over 65 years
COMPARE
Paiute
Immigrants from Moldova
Householder Income Over 65 years
Householder Income Over 65 years Comparison
Paiute
Immigrants from Moldova
$53,762
HOUSEHOLDER INCOME OVER 65 YEARS
0.1/ 100
METRIC RATING
288th/ 347
METRIC RANK
$62,939
HOUSEHOLDER INCOME OVER 65 YEARS
88.7/ 100
METRIC RATING
122nd/ 347
METRIC RANK
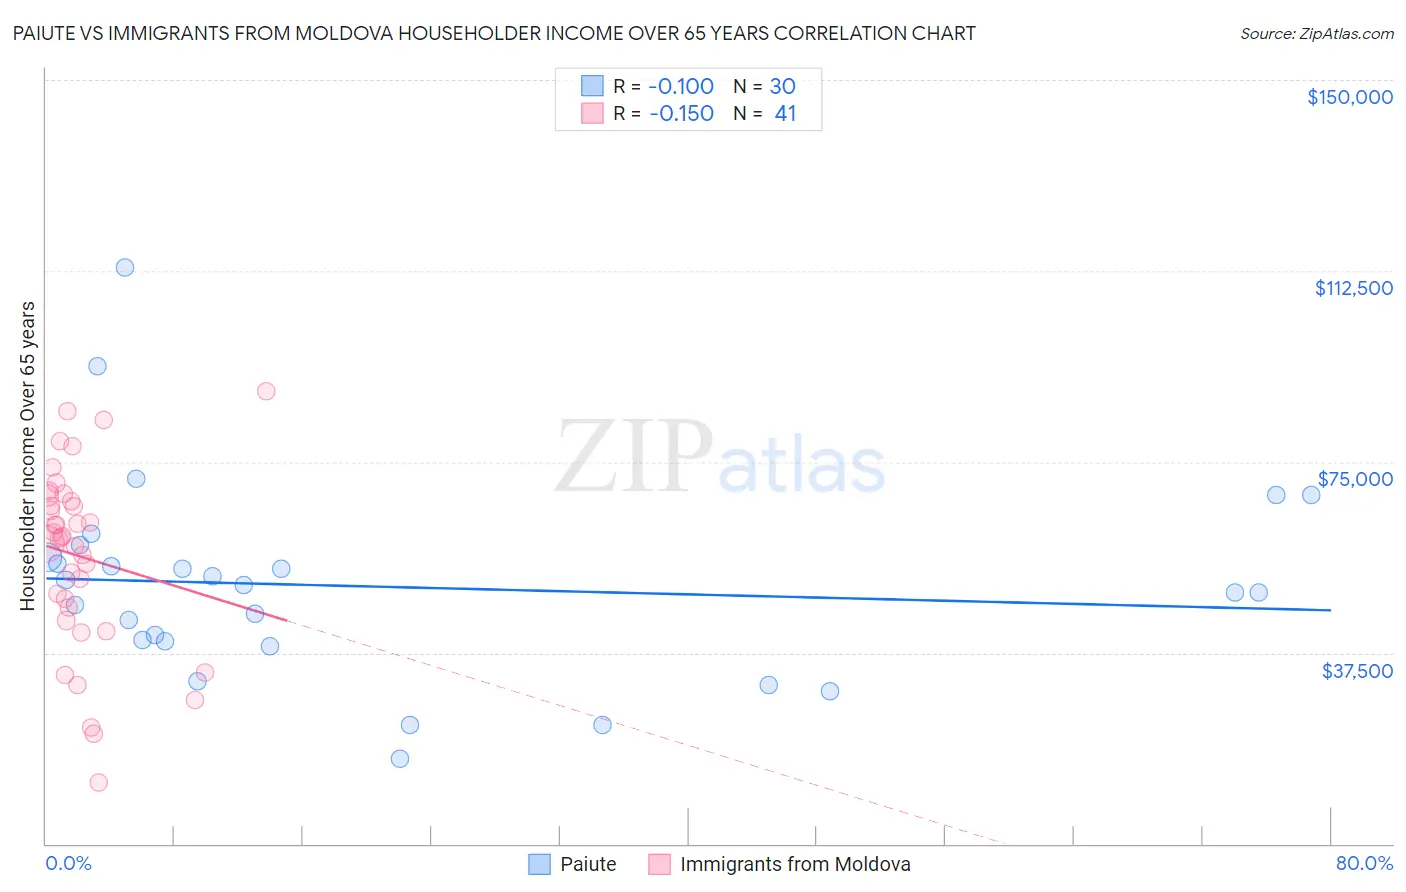
Paiute vs Immigrants from Moldova Householder Income Over 65 years Correlation Chart
The statistical analysis conducted on geographies consisting of 58,330,101 people shows a slight negative correlation between the proportion of Paiute and household income with householder over the age of 65 in the United States with a correlation coefficient (R) of -0.100 and weighted average of $53,762. Similarly, the statistical analysis conducted on geographies consisting of 124,248,392 people shows a poor negative correlation between the proportion of Immigrants from Moldova and household income with householder over the age of 65 in the United States with a correlation coefficient (R) of -0.150 and weighted average of $62,939, a difference of 17.1%.
Householder Income Over 65 years Correlation Summary
| Measurement | Paiute | Immigrants from Moldova |
| Minimum | $16,667 | $12,021 |
| Maximum | $113,167 | $88,833 |
| Range | $96,500 | $76,812 |
| Mean | $50,506 | $56,381 |
| Median | $50,125 | $60,083 |
| Interquartile 25% (IQ1) | $39,874 | $45,078 |
| Interquartile 75% (IQ3) | $56,261 | $67,835 |
| Interquartile Range (IQR) | $16,387 | $22,757 |
| Standard Deviation (Sample) | $19,872 | $17,894 |
| Standard Deviation (Population) | $19,538 | $17,674 |
Similar Demographics by Householder Income Over 65 years
Demographics Similar to Paiute by Householder Income Over 65 years
In terms of householder income over 65 years, the demographic groups most similar to Paiute are Immigrants from Barbados ($53,766, a difference of 0.010%), Iroquois ($53,737, a difference of 0.050%), Chickasaw ($53,732, a difference of 0.060%), African ($53,711, a difference of 0.090%), and Shoshone ($53,681, a difference of 0.15%).
| Demographics | Rating | Rank | Householder Income Over 65 years |
| Somalis | 0.1 /100 | #281 | Tragic $54,004 |
| Immigrants | Armenia | 0.1 /100 | #282 | Tragic $53,974 |
| Immigrants | Liberia | 0.1 /100 | #283 | Tragic $53,967 |
| Immigrants | Guatemala | 0.1 /100 | #284 | Tragic $53,950 |
| Mexicans | 0.1 /100 | #285 | Tragic $53,897 |
| Chippewa | 0.1 /100 | #286 | Tragic $53,847 |
| Immigrants | Barbados | 0.1 /100 | #287 | Tragic $53,766 |
| Paiute | 0.1 /100 | #288 | Tragic $53,762 |
| Iroquois | 0.1 /100 | #289 | Tragic $53,737 |
| Chickasaw | 0.1 /100 | #290 | Tragic $53,732 |
| Africans | 0.0 /100 | #291 | Tragic $53,711 |
| Shoshone | 0.0 /100 | #292 | Tragic $53,681 |
| Immigrants | Belize | 0.0 /100 | #293 | Tragic $53,665 |
| Senegalese | 0.0 /100 | #294 | Tragic $53,591 |
| Immigrants | Central America | 0.0 /100 | #295 | Tragic $53,420 |
Demographics Similar to Immigrants from Moldova by Householder Income Over 65 years
In terms of householder income over 65 years, the demographic groups most similar to Immigrants from Moldova are Tlingit-Haida ($62,922, a difference of 0.030%), Taiwanese ($62,894, a difference of 0.070%), Immigrants from Vietnam ($63,014, a difference of 0.12%), Soviet Union ($62,848, a difference of 0.14%), and Ukrainian ($63,032, a difference of 0.15%).
| Demographics | Rating | Rank | Householder Income Over 65 years |
| Croatians | 91.4 /100 | #115 | Exceptional $63,225 |
| Guamanians/Chamorros | 91.1 /100 | #116 | Exceptional $63,187 |
| Immigrants | Croatia | 90.9 /100 | #117 | Exceptional $63,168 |
| Danes | 90.5 /100 | #118 | Exceptional $63,117 |
| Immigrants | Jordan | 89.8 /100 | #119 | Excellent $63,041 |
| Ukrainians | 89.7 /100 | #120 | Excellent $63,032 |
| Immigrants | Vietnam | 89.5 /100 | #121 | Excellent $63,014 |
| Immigrants | Moldova | 88.7 /100 | #122 | Excellent $62,939 |
| Tlingit-Haida | 88.6 /100 | #123 | Excellent $62,922 |
| Taiwanese | 88.3 /100 | #124 | Excellent $62,894 |
| Soviet Union | 87.8 /100 | #125 | Excellent $62,848 |
| Peruvians | 86.8 /100 | #126 | Excellent $62,766 |
| Swedes | 86.4 /100 | #127 | Excellent $62,736 |
| Aleuts | 86.1 /100 | #128 | Excellent $62,708 |
| Immigrants | Eastern Europe | 85.9 /100 | #129 | Excellent $62,693 |