Celtic vs Immigrants from Southern Europe Median Female Earnings
COMPARE
Celtic
Immigrants from Southern Europe
Median Female Earnings
Median Female Earnings Comparison
Celtics
Immigrants from Southern Europe
$38,283
MEDIAN FEMALE EARNINGS
5.0/ 100
METRIC RATING
234th/ 347
METRIC RANK
$42,275
MEDIAN FEMALE EARNINGS
99.5/ 100
METRIC RATING
81st/ 347
METRIC RANK
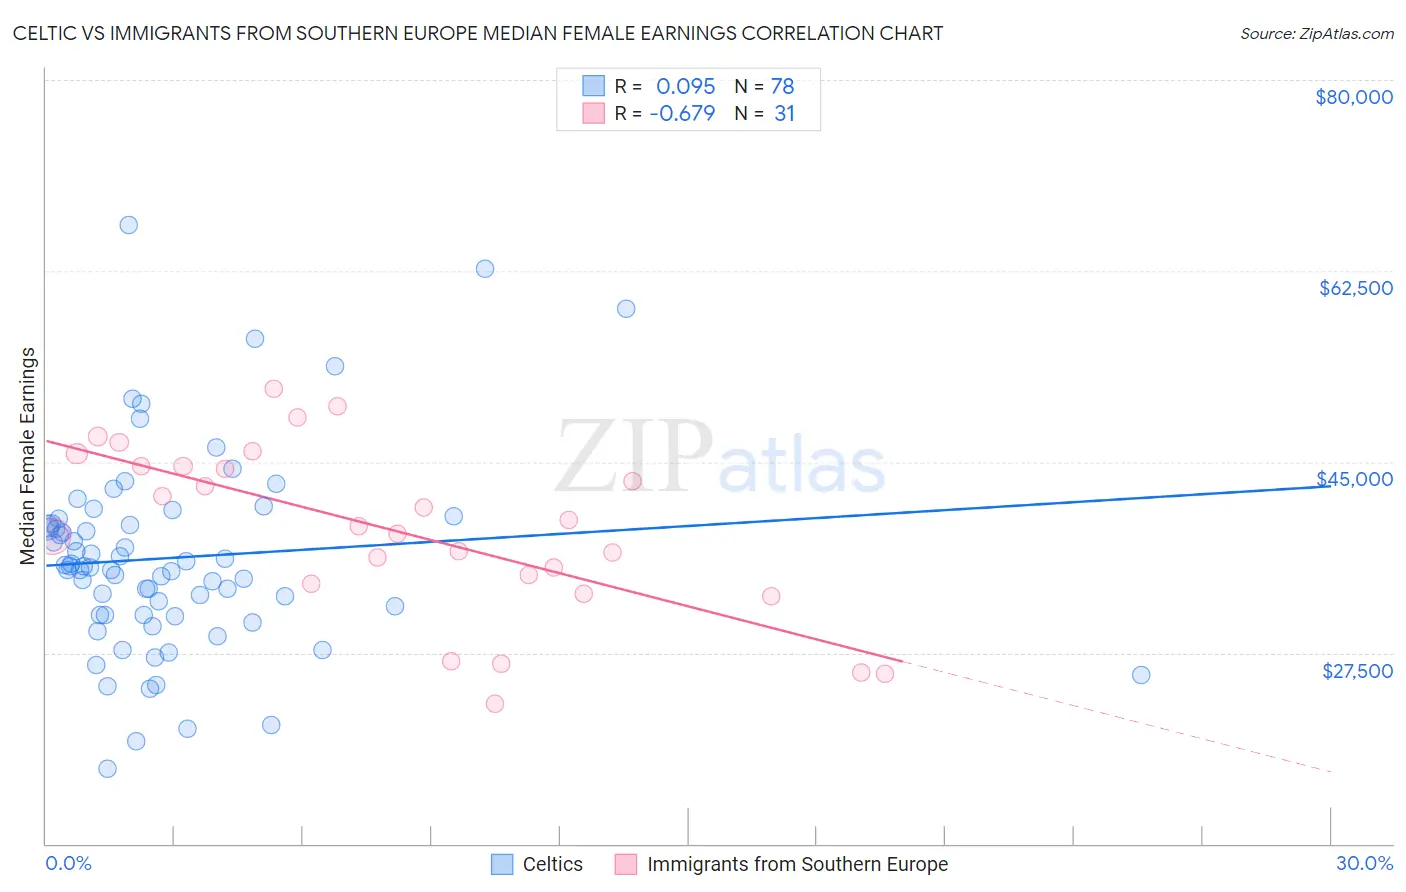
Celtic vs Immigrants from Southern Europe Median Female Earnings Correlation Chart
The statistical analysis conducted on geographies consisting of 168,839,546 people shows a slight positive correlation between the proportion of Celtics and median female earnings in the United States with a correlation coefficient (R) of 0.095 and weighted average of $38,283. Similarly, the statistical analysis conducted on geographies consisting of 402,600,797 people shows a significant negative correlation between the proportion of Immigrants from Southern Europe and median female earnings in the United States with a correlation coefficient (R) of -0.679 and weighted average of $42,275, a difference of 10.4%.
Median Female Earnings Correlation Summary
| Measurement | Celtic | Immigrants from Southern Europe |
| Minimum | $16,819 | $22,783 |
| Maximum | $66,675 | $51,661 |
| Range | $49,856 | $28,878 |
| Mean | $36,202 | $38,726 |
| Median | $35,368 | $39,052 |
| Interquartile 25% (IQ1) | $30,981 | $33,886 |
| Interquartile 75% (IQ3) | $39,367 | $44,613 |
| Interquartile Range (IQR) | $8,386 | $10,727 |
| Standard Deviation (Sample) | $9,110 | $7,794 |
| Standard Deviation (Population) | $9,052 | $7,668 |
Similar Demographics by Median Female Earnings
Demographics Similar to Celtics by Median Female Earnings
In terms of median female earnings, the demographic groups most similar to Celtics are Tongan ($38,288, a difference of 0.010%), Scandinavian ($38,306, a difference of 0.060%), Somali ($38,333, a difference of 0.13%), Basque ($38,352, a difference of 0.18%), and Sudanese ($38,215, a difference of 0.18%).
| Demographics | Rating | Rank | Median Female Earnings |
| Scottish | 6.3 /100 | #227 | Tragic $38,397 |
| Sub-Saharan Africans | 6.2 /100 | #228 | Tragic $38,391 |
| Belgians | 6.1 /100 | #229 | Tragic $38,382 |
| Basques | 5.7 /100 | #230 | Tragic $38,352 |
| Somalis | 5.5 /100 | #231 | Tragic $38,333 |
| Scandinavians | 5.2 /100 | #232 | Tragic $38,306 |
| Tongans | 5.1 /100 | #233 | Tragic $38,288 |
| Celtics | 5.0 /100 | #234 | Tragic $38,283 |
| Sudanese | 4.4 /100 | #235 | Tragic $38,215 |
| Liberians | 4.4 /100 | #236 | Tragic $38,215 |
| Immigrants | Cabo Verde | 4.3 /100 | #237 | Tragic $38,208 |
| Alaska Natives | 4.3 /100 | #238 | Tragic $38,202 |
| English | 4.2 /100 | #239 | Tragic $38,196 |
| Finns | 4.0 /100 | #240 | Tragic $38,173 |
| Spanish | 3.5 /100 | #241 | Tragic $38,098 |
Demographics Similar to Immigrants from Southern Europe by Median Female Earnings
In terms of median female earnings, the demographic groups most similar to Immigrants from Southern Europe are Immigrants from Moldova ($42,304, a difference of 0.070%), Immigrants from Morocco ($42,229, a difference of 0.11%), Immigrants from Sierra Leone ($42,214, a difference of 0.14%), Greek ($42,336, a difference of 0.15%), and Armenian ($42,212, a difference of 0.15%).
| Demographics | Rating | Rank | Median Female Earnings |
| Immigrants | South Africa | 99.7 /100 | #74 | Exceptional $42,508 |
| New Zealanders | 99.7 /100 | #75 | Exceptional $42,446 |
| Immigrants | Italy | 99.7 /100 | #76 | Exceptional $42,446 |
| Immigrants | Albania | 99.6 /100 | #77 | Exceptional $42,388 |
| Immigrants | Kazakhstan | 99.6 /100 | #78 | Exceptional $42,386 |
| Greeks | 99.6 /100 | #79 | Exceptional $42,336 |
| Immigrants | Moldova | 99.6 /100 | #80 | Exceptional $42,304 |
| Immigrants | Southern Europe | 99.5 /100 | #81 | Exceptional $42,275 |
| Immigrants | Morocco | 99.5 /100 | #82 | Exceptional $42,229 |
| Immigrants | Sierra Leone | 99.5 /100 | #83 | Exceptional $42,214 |
| Armenians | 99.5 /100 | #84 | Exceptional $42,212 |
| Laotians | 99.4 /100 | #85 | Exceptional $42,133 |
| Immigrants | St. Vincent and the Grenadines | 99.3 /100 | #86 | Exceptional $42,108 |
| Lithuanians | 99.3 /100 | #87 | Exceptional $42,108 |
| Immigrants | Northern Africa | 99.3 /100 | #88 | Exceptional $42,084 |