Immigrants from Liberia vs Colville Median Household Income
COMPARE
Immigrants from Liberia
Colville
Median Household Income
Median Household Income Comparison
Immigrants from Liberia
Colville
$74,896
MEDIAN HOUSEHOLD INCOME
0.1/ 100
METRIC RATING
281st/ 347
METRIC RANK
$70,094
MEDIAN HOUSEHOLD INCOME
0.0/ 100
METRIC RATING
320th/ 347
METRIC RANK
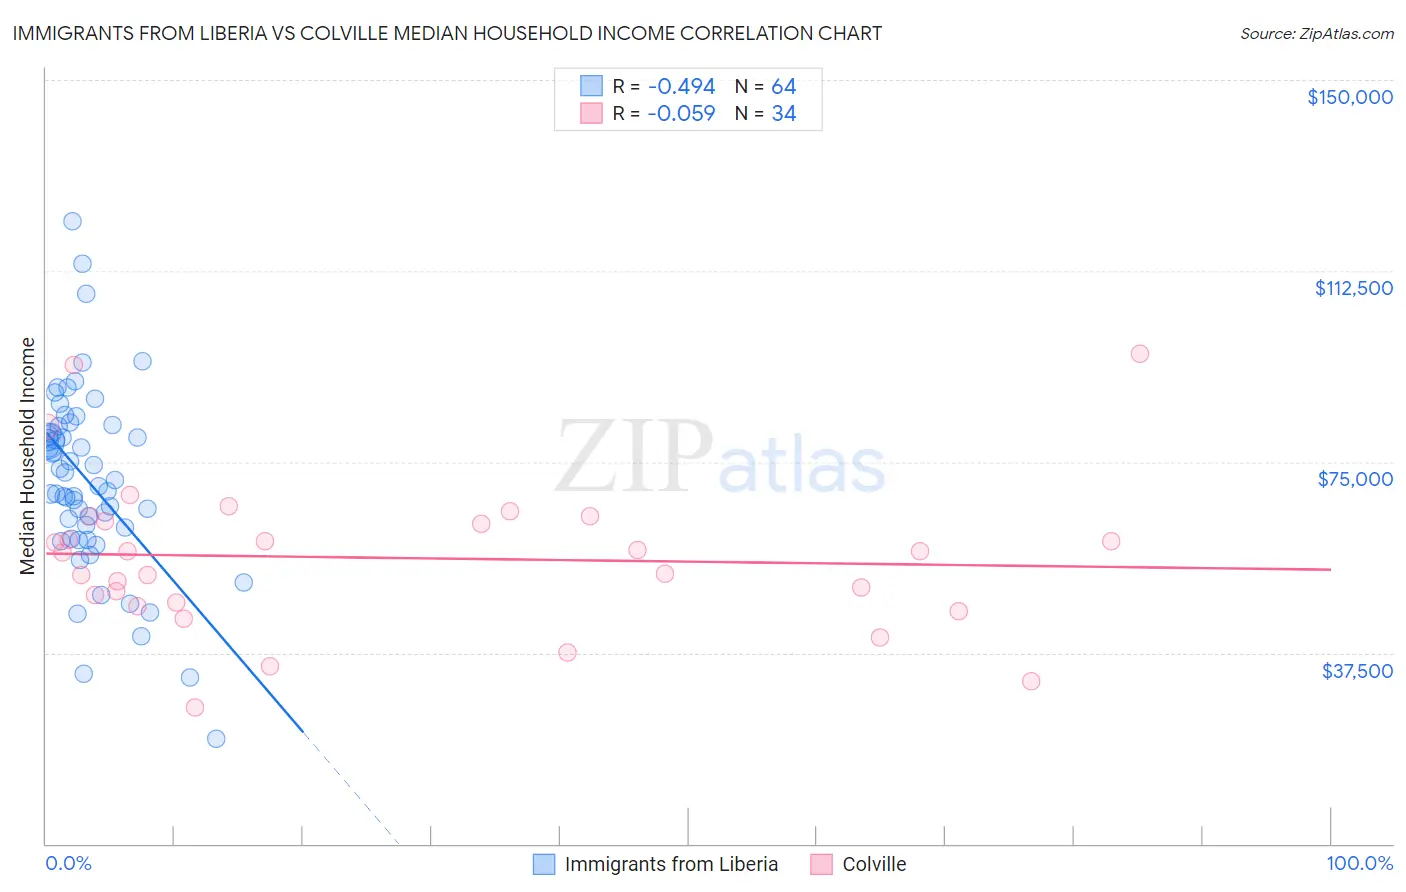
Immigrants from Liberia vs Colville Median Household Income Correlation Chart
The statistical analysis conducted on geographies consisting of 135,245,010 people shows a moderate negative correlation between the proportion of Immigrants from Liberia and median household income in the United States with a correlation coefficient (R) of -0.494 and weighted average of $74,896. Similarly, the statistical analysis conducted on geographies consisting of 34,681,598 people shows a slight negative correlation between the proportion of Colville and median household income in the United States with a correlation coefficient (R) of -0.059 and weighted average of $70,094, a difference of 6.9%.
Median Household Income Correlation Summary
| Measurement | Immigrants from Liberia | Colville |
| Minimum | $20,699 | $26,823 |
| Maximum | $122,146 | $96,250 |
| Range | $101,447 | $69,427 |
| Mean | $71,180 | $56,145 |
| Median | $70,898 | $57,218 |
| Interquartile 25% (IQ1) | $61,014 | $47,361 |
| Interquartile 75% (IQ3) | $81,401 | $63,313 |
| Interquartile Range (IQR) | $20,387 | $15,952 |
| Standard Deviation (Sample) | $18,219 | $14,989 |
| Standard Deviation (Population) | $18,076 | $14,767 |
Similar Demographics by Median Household Income
Demographics Similar to Immigrants from Liberia by Median Household Income
In terms of median household income, the demographic groups most similar to Immigrants from Liberia are Central American Indian ($74,847, a difference of 0.070%), Senegalese ($74,999, a difference of 0.14%), Cree ($74,685, a difference of 0.28%), Immigrants from Guatemala ($75,123, a difference of 0.30%), and Yaqui ($74,596, a difference of 0.40%).
| Demographics | Rating | Rank | Median Household Income |
| British West Indians | 0.2 /100 | #274 | Tragic $75,647 |
| Immigrants | Micronesia | 0.2 /100 | #275 | Tragic $75,574 |
| Immigrants | Latin America | 0.2 /100 | #276 | Tragic $75,420 |
| Spanish Americans | 0.2 /100 | #277 | Tragic $75,386 |
| Osage | 0.2 /100 | #278 | Tragic $75,240 |
| Immigrants | Guatemala | 0.2 /100 | #279 | Tragic $75,123 |
| Senegalese | 0.2 /100 | #280 | Tragic $74,999 |
| Immigrants | Liberia | 0.1 /100 | #281 | Tragic $74,896 |
| Central American Indians | 0.1 /100 | #282 | Tragic $74,847 |
| Cree | 0.1 /100 | #283 | Tragic $74,685 |
| Yaqui | 0.1 /100 | #284 | Tragic $74,596 |
| Mexicans | 0.1 /100 | #285 | Tragic $74,399 |
| Immigrants | Somalia | 0.1 /100 | #286 | Tragic $74,300 |
| Iroquois | 0.1 /100 | #287 | Tragic $74,279 |
| Immigrants | Central America | 0.1 /100 | #288 | Tragic $74,217 |
Demographics Similar to Colville by Median Household Income
In terms of median household income, the demographic groups most similar to Colville are Chickasaw ($70,005, a difference of 0.13%), Immigrants from Dominican Republic ($70,208, a difference of 0.16%), Choctaw ($69,947, a difference of 0.21%), Bahamian ($69,726, a difference of 0.53%), and Yup'ik ($69,695, a difference of 0.57%).
| Demographics | Rating | Rank | Median Household Income |
| Immigrants | Bahamas | 0.0 /100 | #313 | Tragic $71,349 |
| Dominicans | 0.0 /100 | #314 | Tragic $71,302 |
| Ottawa | 0.0 /100 | #315 | Tragic $70,984 |
| Apache | 0.0 /100 | #316 | Tragic $70,927 |
| Cajuns | 0.0 /100 | #317 | Tragic $70,605 |
| Chippewa | 0.0 /100 | #318 | Tragic $70,539 |
| Immigrants | Dominican Republic | 0.0 /100 | #319 | Tragic $70,208 |
| Colville | 0.0 /100 | #320 | Tragic $70,094 |
| Chickasaw | 0.0 /100 | #321 | Tragic $70,005 |
| Choctaw | 0.0 /100 | #322 | Tragic $69,947 |
| Bahamians | 0.0 /100 | #323 | Tragic $69,726 |
| Yup'ik | 0.0 /100 | #324 | Tragic $69,695 |
| Seminole | 0.0 /100 | #325 | Tragic $69,420 |
| Yuman | 0.0 /100 | #326 | Tragic $68,743 |
| Immigrants | Cuba | 0.0 /100 | #327 | Tragic $68,461 |