Hispanic or Latino vs Basque Median Female Earnings
COMPARE
Hispanic or Latino
Basque
Median Female Earnings
Median Female Earnings Comparison
Hispanics or Latinos
Basques
$34,421
MEDIAN FEMALE EARNINGS
0.0/ 100
METRIC RATING
321st/ 347
METRIC RANK
$38,352
MEDIAN FEMALE EARNINGS
5.7/ 100
METRIC RATING
230th/ 347
METRIC RANK
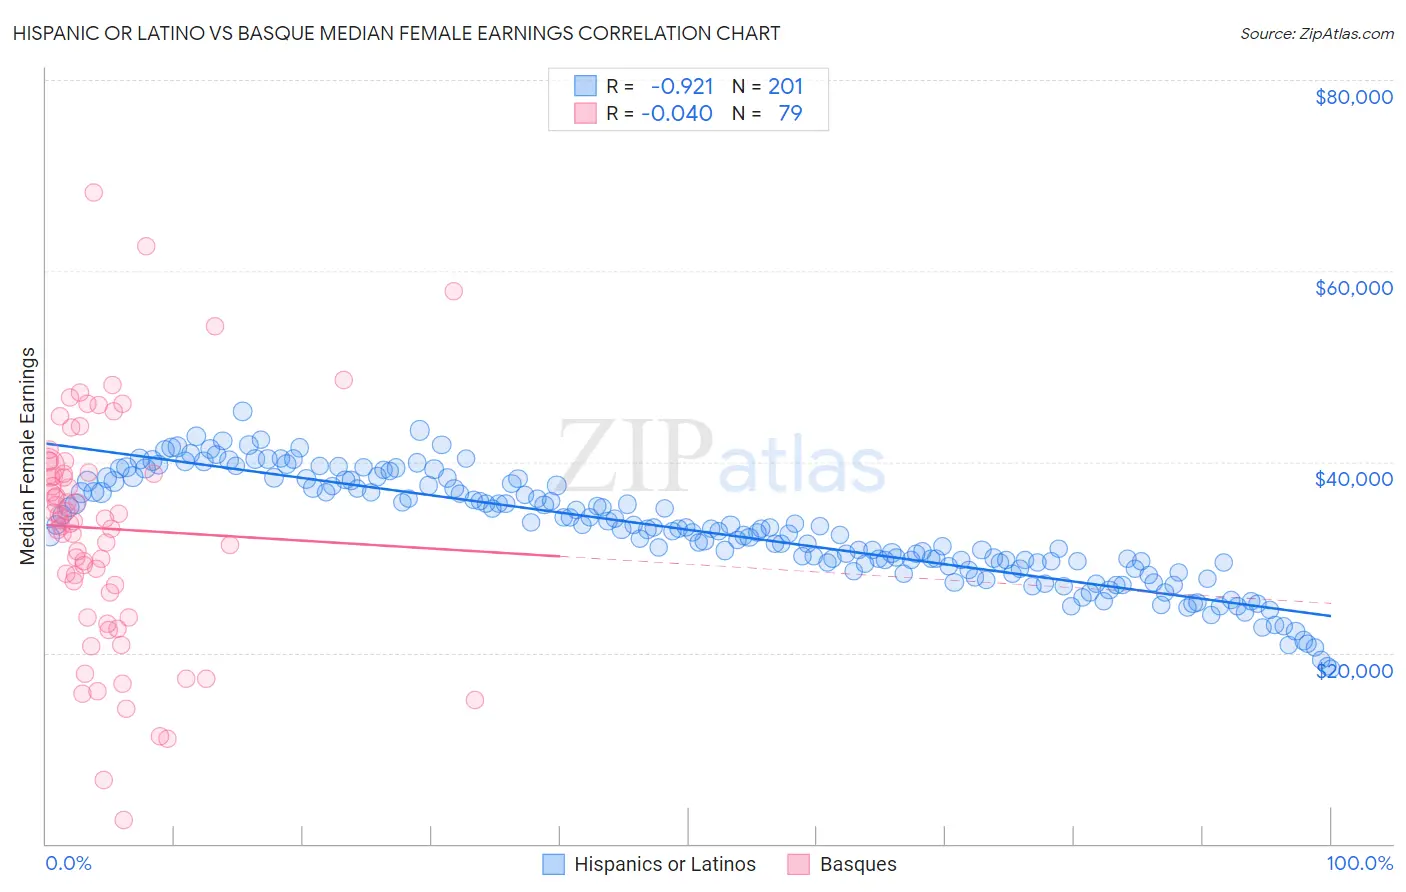
Hispanic or Latino vs Basque Median Female Earnings Correlation Chart
The statistical analysis conducted on geographies consisting of 576,408,721 people shows a near-perfect negative correlation between the proportion of Hispanics or Latinos and median female earnings in the United States with a correlation coefficient (R) of -0.921 and weighted average of $34,421. Similarly, the statistical analysis conducted on geographies consisting of 165,731,854 people shows no correlation between the proportion of Basques and median female earnings in the United States with a correlation coefficient (R) of -0.040 and weighted average of $38,352, a difference of 11.4%.
Median Female Earnings Correlation Summary
| Measurement | Hispanic or Latino | Basque |
| Minimum | $18,390 | $2,499 |
| Maximum | $45,279 | $68,214 |
| Range | $26,890 | $65,715 |
| Mean | $32,838 | $33,005 |
| Median | $32,964 | $33,892 |
| Interquartile 25% (IQ1) | $29,181 | $26,382 |
| Interquartile 75% (IQ3) | $37,606 | $39,564 |
| Interquartile Range (IQR) | $8,426 | $13,182 |
| Standard Deviation (Sample) | $5,710 | $12,137 |
| Standard Deviation (Population) | $5,696 | $12,060 |
Similar Demographics by Median Female Earnings
Demographics Similar to Hispanics or Latinos by Median Female Earnings
In terms of median female earnings, the demographic groups most similar to Hispanics or Latinos are Chickasaw ($34,414, a difference of 0.020%), Seminole ($34,385, a difference of 0.11%), Immigrants from Congo ($34,317, a difference of 0.31%), Immigrants from Honduras ($34,647, a difference of 0.66%), and Shoshone ($34,677, a difference of 0.74%).
| Demographics | Rating | Rank | Median Female Earnings |
| Apache | 0.0 /100 | #314 | Tragic $34,895 |
| Pennsylvania Germans | 0.0 /100 | #315 | Tragic $34,802 |
| Cherokee | 0.0 /100 | #316 | Tragic $34,742 |
| Potawatomi | 0.0 /100 | #317 | Tragic $34,739 |
| Immigrants | Yemen | 0.0 /100 | #318 | Tragic $34,693 |
| Shoshone | 0.0 /100 | #319 | Tragic $34,677 |
| Immigrants | Honduras | 0.0 /100 | #320 | Tragic $34,647 |
| Hispanics or Latinos | 0.0 /100 | #321 | Tragic $34,421 |
| Chickasaw | 0.0 /100 | #322 | Tragic $34,414 |
| Seminole | 0.0 /100 | #323 | Tragic $34,385 |
| Immigrants | Congo | 0.0 /100 | #324 | Tragic $34,317 |
| Dutch West Indians | 0.0 /100 | #325 | Tragic $34,106 |
| Kiowa | 0.0 /100 | #326 | Tragic $34,074 |
| Cajuns | 0.0 /100 | #327 | Tragic $34,034 |
| Immigrants | Central America | 0.0 /100 | #328 | Tragic $33,953 |
Demographics Similar to Basques by Median Female Earnings
In terms of median female earnings, the demographic groups most similar to Basques are Somali ($38,333, a difference of 0.050%), Belgian ($38,382, a difference of 0.080%), Subsaharan African ($38,391, a difference of 0.10%), Scottish ($38,397, a difference of 0.12%), and Scandinavian ($38,306, a difference of 0.12%).
| Demographics | Rating | Rank | Median Female Earnings |
| Immigrants | Sudan | 7.8 /100 | #223 | Tragic $38,511 |
| Native Hawaiians | 7.1 /100 | #224 | Tragic $38,461 |
| French | 7.0 /100 | #225 | Tragic $38,457 |
| French Canadians | 6.8 /100 | #226 | Tragic $38,436 |
| Scottish | 6.3 /100 | #227 | Tragic $38,397 |
| Sub-Saharan Africans | 6.2 /100 | #228 | Tragic $38,391 |
| Belgians | 6.1 /100 | #229 | Tragic $38,382 |
| Basques | 5.7 /100 | #230 | Tragic $38,352 |
| Somalis | 5.5 /100 | #231 | Tragic $38,333 |
| Scandinavians | 5.2 /100 | #232 | Tragic $38,306 |
| Tongans | 5.1 /100 | #233 | Tragic $38,288 |
| Celtics | 5.0 /100 | #234 | Tragic $38,283 |
| Sudanese | 4.4 /100 | #235 | Tragic $38,215 |
| Liberians | 4.4 /100 | #236 | Tragic $38,215 |
| Immigrants | Cabo Verde | 4.3 /100 | #237 | Tragic $38,208 |