Immigrants from Indonesia vs Immigrants from Greece Householder Income Ages 45 - 64 years
COMPARE
Immigrants from Indonesia
Immigrants from Greece
Householder Income Ages 45 - 64 years
Householder Income Ages 45 - 64 years Comparison
Immigrants from Indonesia
Immigrants from Greece
$113,519
HOUSEHOLDER INCOME AGES 45 - 64 YEARS
99.9/ 100
METRIC RATING
48th/ 347
METRIC RANK
$113,548
HOUSEHOLDER INCOME AGES 45 - 64 YEARS
99.9/ 100
METRIC RATING
46th/ 347
METRIC RANK
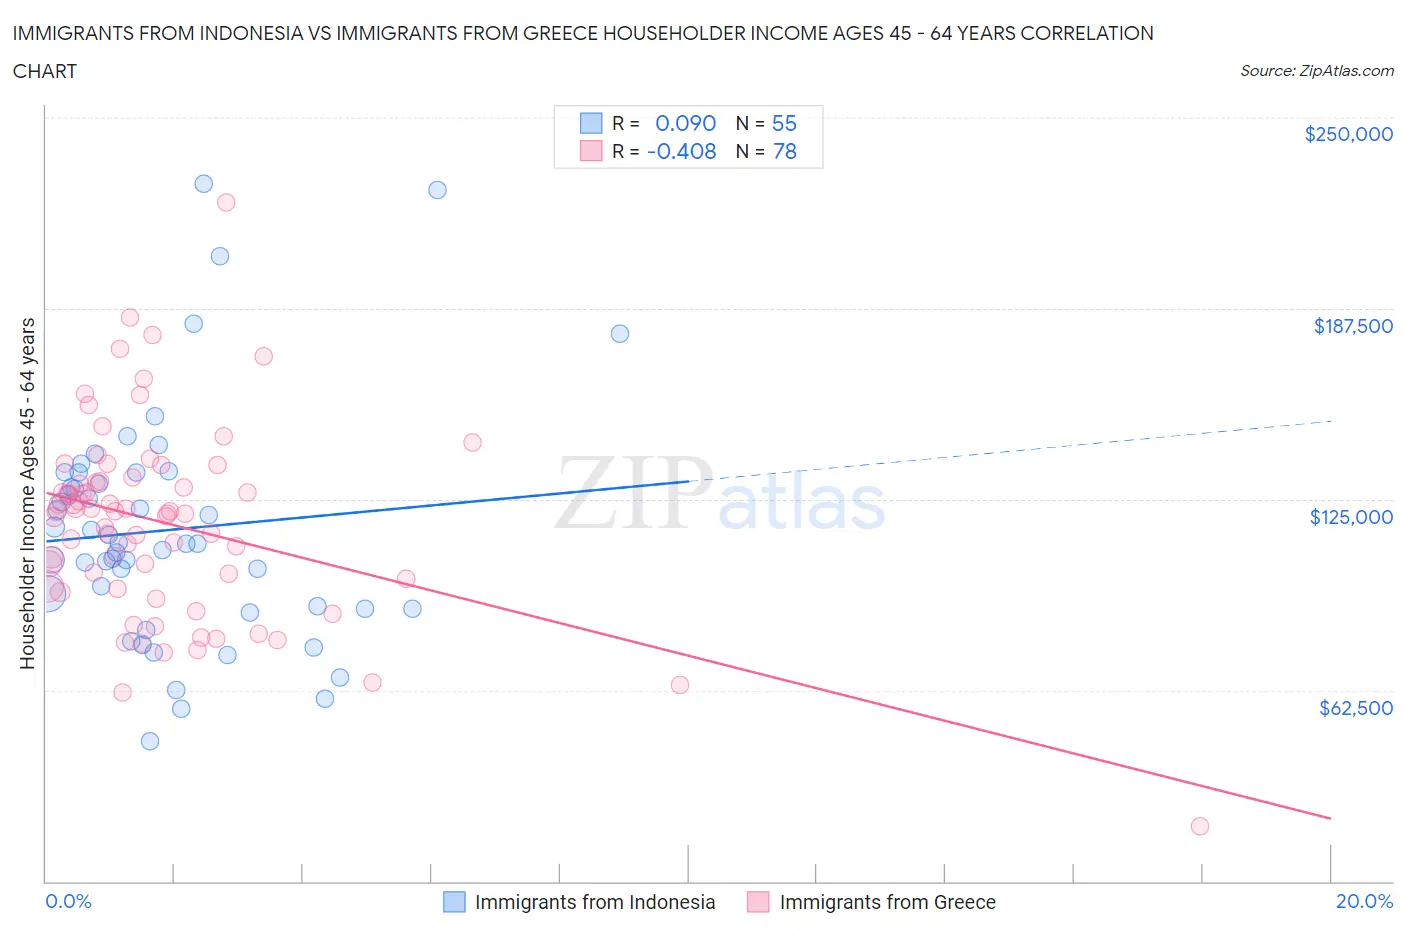
Immigrants from Indonesia vs Immigrants from Greece Householder Income Ages 45 - 64 years Correlation Chart
The statistical analysis conducted on geographies consisting of 215,592,111 people shows a slight positive correlation between the proportion of Immigrants from Indonesia and household income with householder between the ages 45 and 64 in the United States with a correlation coefficient (R) of 0.090 and weighted average of $113,519. Similarly, the statistical analysis conducted on geographies consisting of 216,803,825 people shows a moderate negative correlation between the proportion of Immigrants from Greece and household income with householder between the ages 45 and 64 in the United States with a correlation coefficient (R) of -0.408 and weighted average of $113,548, a difference of 0.030%.
Householder Income Ages 45 - 64 years Correlation Summary
| Measurement | Immigrants from Indonesia | Immigrants from Greece |
| Minimum | $45,964 | $18,083 |
| Maximum | $228,214 | $222,000 |
| Range | $182,250 | $203,917 |
| Mean | $114,986 | $117,037 |
| Median | $110,532 | $120,719 |
| Interquartile 25% (IQ1) | $89,063 | $96,498 |
| Interquartile 75% (IQ3) | $133,651 | $131,127 |
| Interquartile Range (IQR) | $44,588 | $34,629 |
| Standard Deviation (Sample) | $37,980 | $31,775 |
| Standard Deviation (Population) | $37,633 | $31,571 |
Demographics Similar to Immigrants from Indonesia and Immigrants from Greece by Householder Income Ages 45 - 64 years
In terms of householder income ages 45 - 64 years, the demographic groups most similar to Immigrants from Indonesia are Australian ($113,533, a difference of 0.010%), Immigrants from France ($113,680, a difference of 0.14%), Immigrants from Russia ($113,215, a difference of 0.27%), Bulgarian ($113,883, a difference of 0.32%), and Immigrants from Austria ($113,140, a difference of 0.34%). Similarly, the demographic groups most similar to Immigrants from Greece are Australian ($113,533, a difference of 0.010%), Immigrants from France ($113,680, a difference of 0.12%), Bulgarian ($113,883, a difference of 0.29%), Immigrants from Russia ($113,215, a difference of 0.29%), and Immigrants from Austria ($113,140, a difference of 0.36%).
| Demographics | Rating | Rank | Householder Income Ages 45 - 64 years |
| Maltese | 99.9 /100 | #37 | Exceptional $114,754 |
| Immigrants | Pakistan | 99.9 /100 | #38 | Exceptional $114,434 |
| Immigrants | Turkey | 99.9 /100 | #39 | Exceptional $114,407 |
| Cambodians | 99.9 /100 | #40 | Exceptional $114,342 |
| Immigrants | Lithuania | 99.9 /100 | #41 | Exceptional $114,336 |
| Estonians | 99.9 /100 | #42 | Exceptional $114,220 |
| Israelis | 99.9 /100 | #43 | Exceptional $114,186 |
| Bulgarians | 99.9 /100 | #44 | Exceptional $113,883 |
| Immigrants | France | 99.9 /100 | #45 | Exceptional $113,680 |
| Immigrants | Greece | 99.9 /100 | #46 | Exceptional $113,548 |
| Australians | 99.9 /100 | #47 | Exceptional $113,533 |
| Immigrants | Indonesia | 99.9 /100 | #48 | Exceptional $113,519 |
| Immigrants | Russia | 99.8 /100 | #49 | Exceptional $113,215 |
| Immigrants | Austria | 99.8 /100 | #50 | Exceptional $113,140 |
| Immigrants | South Africa | 99.8 /100 | #51 | Exceptional $112,886 |
| Immigrants | Malaysia | 99.8 /100 | #52 | Exceptional $112,796 |
| Afghans | 99.8 /100 | #53 | Exceptional $112,676 |
| Greeks | 99.8 /100 | #54 | Exceptional $112,630 |
| Lithuanians | 99.8 /100 | #55 | Exceptional $112,484 |
| Egyptians | 99.7 /100 | #56 | Exceptional $112,256 |
| Immigrants | Scotland | 99.7 /100 | #57 | Exceptional $112,175 |