Indian (Asian) vs Immigrants from Greece Householder Income Ages 45 - 64 years
COMPARE
Indian (Asian)
Immigrants from Greece
Householder Income Ages 45 - 64 years
Householder Income Ages 45 - 64 years Comparison
Indians (Asian)
Immigrants from Greece
$122,343
HOUSEHOLDER INCOME AGES 45 - 64 YEARS
100.0/ 100
METRIC RATING
14th/ 347
METRIC RANK
$113,548
HOUSEHOLDER INCOME AGES 45 - 64 YEARS
99.9/ 100
METRIC RATING
46th/ 347
METRIC RANK
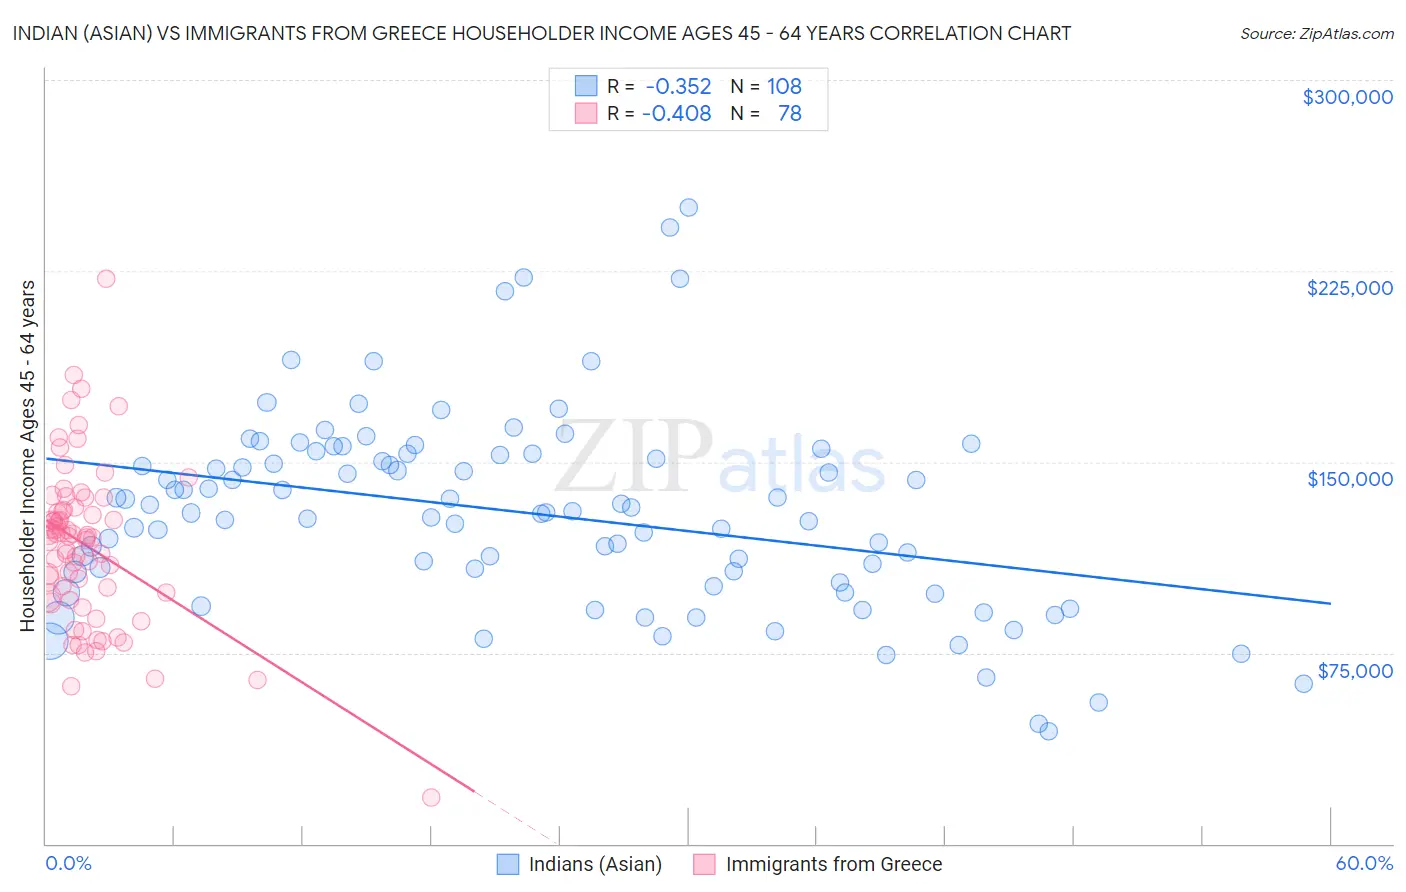
Indian (Asian) vs Immigrants from Greece Householder Income Ages 45 - 64 years Correlation Chart
The statistical analysis conducted on geographies consisting of 493,767,636 people shows a mild negative correlation between the proportion of Indians (Asian) and household income with householder between the ages 45 and 64 in the United States with a correlation coefficient (R) of -0.352 and weighted average of $122,343. Similarly, the statistical analysis conducted on geographies consisting of 216,803,825 people shows a moderate negative correlation between the proportion of Immigrants from Greece and household income with householder between the ages 45 and 64 in the United States with a correlation coefficient (R) of -0.408 and weighted average of $113,548, a difference of 7.7%.
Householder Income Ages 45 - 64 years Correlation Summary
| Measurement | Indian (Asian) | Immigrants from Greece |
| Minimum | $44,167 | $18,083 |
| Maximum | $250,001 | $222,000 |
| Range | $205,834 | $203,917 |
| Mean | $130,085 | $117,037 |
| Median | $130,239 | $120,719 |
| Interquartile 25% (IQ1) | $104,628 | $96,498 |
| Interquartile 75% (IQ3) | $152,944 | $131,127 |
| Interquartile Range (IQR) | $48,316 | $34,629 |
| Standard Deviation (Sample) | $38,442 | $31,775 |
| Standard Deviation (Population) | $38,264 | $31,571 |
Similar Demographics by Householder Income Ages 45 - 64 years
Demographics Similar to Indians (Asian) by Householder Income Ages 45 - 64 years
In terms of householder income ages 45 - 64 years, the demographic groups most similar to Indians (Asian) are Immigrants from Eastern Asia ($122,222, a difference of 0.10%), Immigrants from China ($122,178, a difference of 0.14%), Immigrants from Ireland ($122,757, a difference of 0.34%), Immigrants from Israel ($122,893, a difference of 0.45%), and Burmese ($121,444, a difference of 0.74%).
| Demographics | Rating | Rank | Householder Income Ages 45 - 64 years |
| Immigrants | Hong Kong | 100.0 /100 | #7 | Exceptional $127,500 |
| Immigrants | Iran | 100.0 /100 | #8 | Exceptional $126,940 |
| Okinawans | 100.0 /100 | #9 | Exceptional $124,796 |
| Immigrants | South Central Asia | 100.0 /100 | #10 | Exceptional $124,188 |
| Cypriots | 100.0 /100 | #11 | Exceptional $123,396 |
| Immigrants | Israel | 100.0 /100 | #12 | Exceptional $122,893 |
| Immigrants | Ireland | 100.0 /100 | #13 | Exceptional $122,757 |
| Indians (Asian) | 100.0 /100 | #14 | Exceptional $122,343 |
| Immigrants | Eastern Asia | 100.0 /100 | #15 | Exceptional $122,222 |
| Immigrants | China | 100.0 /100 | #16 | Exceptional $122,178 |
| Burmese | 100.0 /100 | #17 | Exceptional $121,444 |
| Immigrants | Korea | 100.0 /100 | #18 | Exceptional $121,243 |
| Eastern Europeans | 100.0 /100 | #19 | Exceptional $120,684 |
| Immigrants | Australia | 100.0 /100 | #20 | Exceptional $119,308 |
| Immigrants | Sri Lanka | 100.0 /100 | #21 | Exceptional $119,094 |
Demographics Similar to Immigrants from Greece by Householder Income Ages 45 - 64 years
In terms of householder income ages 45 - 64 years, the demographic groups most similar to Immigrants from Greece are Australian ($113,533, a difference of 0.010%), Immigrants from Indonesia ($113,519, a difference of 0.030%), Immigrants from France ($113,680, a difference of 0.12%), Bulgarian ($113,883, a difference of 0.29%), and Immigrants from Russia ($113,215, a difference of 0.29%).
| Demographics | Rating | Rank | Householder Income Ages 45 - 64 years |
| Immigrants | Turkey | 99.9 /100 | #39 | Exceptional $114,407 |
| Cambodians | 99.9 /100 | #40 | Exceptional $114,342 |
| Immigrants | Lithuania | 99.9 /100 | #41 | Exceptional $114,336 |
| Estonians | 99.9 /100 | #42 | Exceptional $114,220 |
| Israelis | 99.9 /100 | #43 | Exceptional $114,186 |
| Bulgarians | 99.9 /100 | #44 | Exceptional $113,883 |
| Immigrants | France | 99.9 /100 | #45 | Exceptional $113,680 |
| Immigrants | Greece | 99.9 /100 | #46 | Exceptional $113,548 |
| Australians | 99.9 /100 | #47 | Exceptional $113,533 |
| Immigrants | Indonesia | 99.9 /100 | #48 | Exceptional $113,519 |
| Immigrants | Russia | 99.8 /100 | #49 | Exceptional $113,215 |
| Immigrants | Austria | 99.8 /100 | #50 | Exceptional $113,140 |
| Immigrants | South Africa | 99.8 /100 | #51 | Exceptional $112,886 |
| Immigrants | Malaysia | 99.8 /100 | #52 | Exceptional $112,796 |
| Afghans | 99.8 /100 | #53 | Exceptional $112,676 |